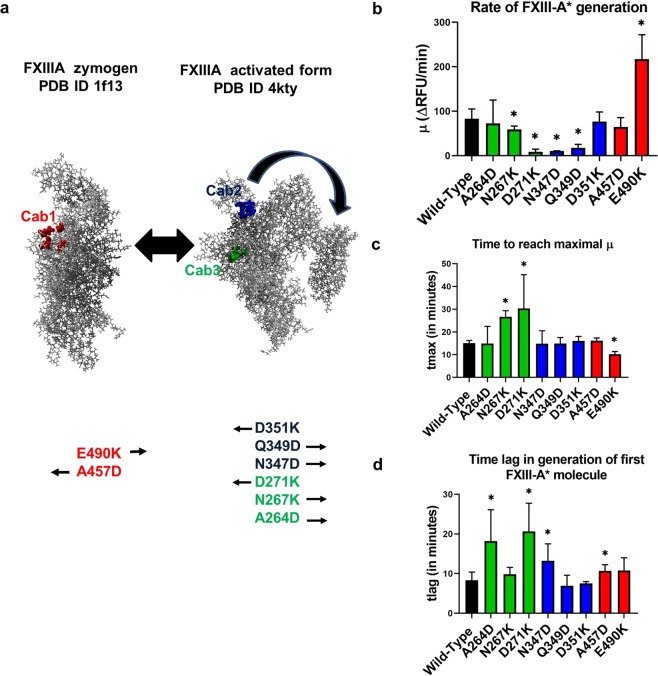
Figure 3.
Results of FXIII-A* generation assay for rFXIII-A calcium binding site mutants. Panel a explains the principle underlying different rFXIII-A calcium binding site mutants generated in this study. It depicts the conformational transformation between the zymogenic and activated FXIII-A crystal structures. Both structures are depicted as grey ball and stick models. The first calcium binding site (Cab1) residues are depicted as red ball models on the zymogenic FXIII-A crystal structure because the coordination of this site is a zymogenic constraint. The second and third calcium binding site (Cab2 and Cab3) are depicted as blue and green ball models respectively on the activated FXIII-A* crystal structure. Below both these structures, the mutants generated for this study are listed with arrows indicating the anticipated structure favored by each of this mutant as per our hypothesis. Panels b, c and d depict the comparative bar graphs corresponding to three major parameters (μ, tmax and tlag) obtained from the FXIII-A* generation assay. In the event a variant is significantly different than the wild type, it is marked with a star (*) sign on top of the corresponding bar. Statistical significance is set at p < 0.05. Experiments were performed in in duplicates, thrice (N = 6). Please note, FXIII-A* generation data for the mutants D271K and N347D show very low activity and a fit of the data to the model revealed no valid estimates.

