Figure 4.
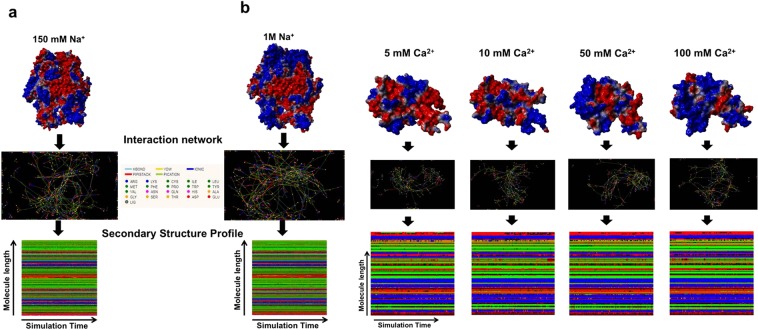
Effect of calcium and sodium on the structure of FXIII-A. Upper parts of panels a and b represent the simulation snapshots of full length FXIII-A molecule and FXIII-A core domain post 100 ns of simulation in different sodium and calcium concentrations respectively as indicated. The simulation snapshot structures are depicted by their molecular surface view with the electrostatic potential (Red: Negative, Blue: Positive) superimposed on it. Below the simulation snapshots in both panels are the Residue interaction network (RIN) or the inter-residue interaction chart extracted from the Ring 2.0 server by submitting to it the post 100 ns simulation snapshot as a PDB file under default server conditions. Lowermost section of both panels is the Secondary structure profile for the entire 100 ns of simulation plotted for the entire length of the molecule. The colour code for the secondary structure profile is the following: Coil: Red, Strand: Green, Helix: Blue, Turn: Black.

