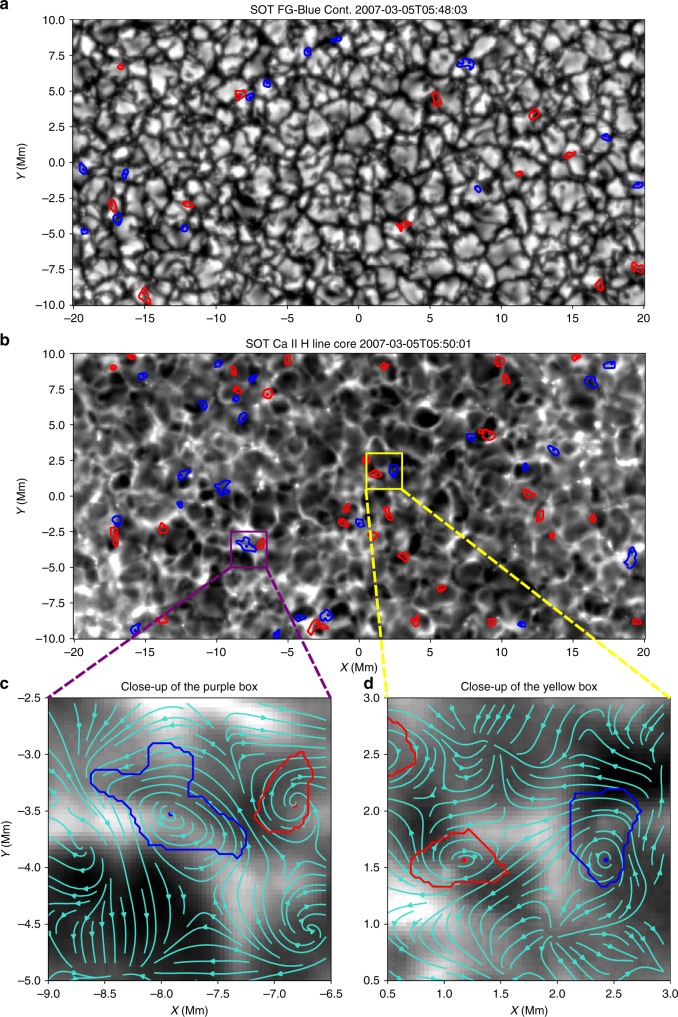
Fig. 1.
Photospheric and chromospheric swirls detected by ASDA using SOT observations. The observed intensity is shown as the white-black background in all panels. Photospheric intensity swirls (a) detected at 05:48:03 UT were found to be best correlated with chromospheric swirls (b) detected 118 s later (05:50:01 UT). Swirls, with positive (negative) rotating direction are denoted in blue (red). Contours and dots are their edges and centres, respectively. Turquoise arrows in c, d represent the tracked velocity field by the FLCT method25,26. The analysed data contain a series of photospheric and chromospheric observations in a quiet region close to the disk centre. Source data are provided in the Source Data file

