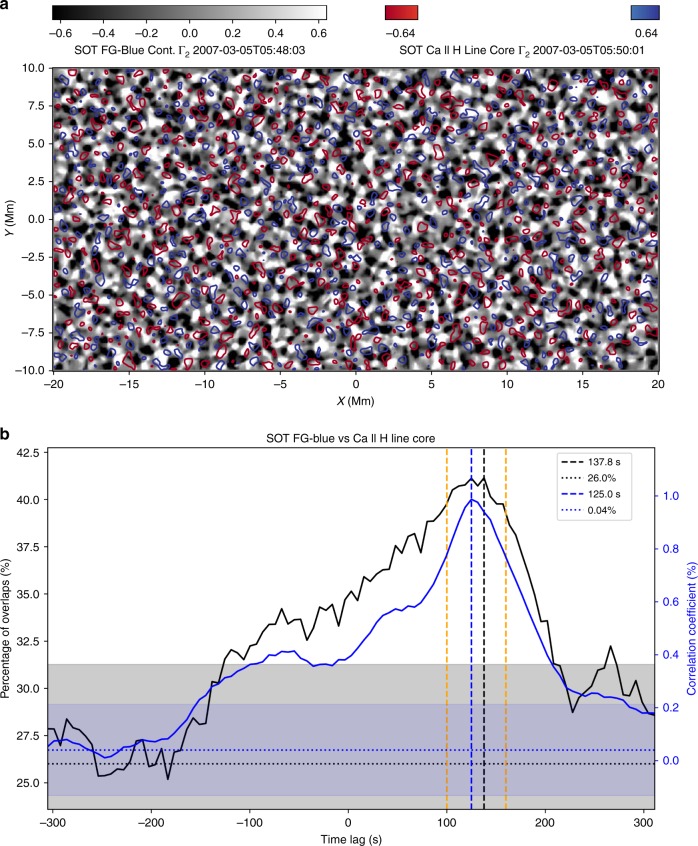
Fig. 3.
Correlations between photospheric and chromospheric swirls detected by the SOT. The black-white background in a shows the Γ2 distribution of the photospheric observation by the SOT FG-Blue continuum at 05:48:03 UT. It has a peak correlation index (CI ~ 2.4%) with the Γ2 distribution of the Ca II H chromospheric observation (red and blue contours) 118 seconds later at 05:50:01. The two unitless colorbars show the scales of Γ2. b The blue and black solid curves are the CI and percentage of overlaps between the SOT photospheric and chromospheric swirls varying with different time lags, respectively. The vertical blue and black dashed lines represent the peak of the CI and percentage of overlaps at a time lag of 125 and 138 s, respectively. The two vertical orange dashed lines correspond to time lags of 100 and 160 s, respectively. Via performing 50 times of random shuffle on the series of observations, we have also obtained their corresponding levels of errors (blue and black dotted lines, 0.04% and 26%) and 5σ ranges (blue and grey shadows). Source data are provided in the Source Data file

