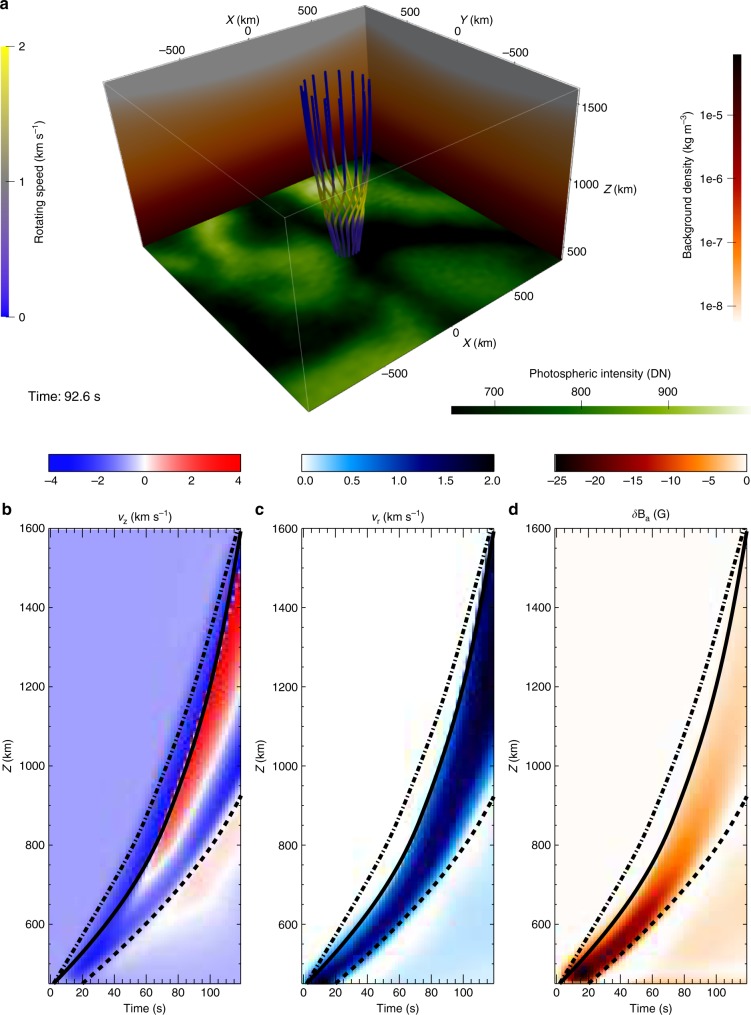
Fig. 4.
Visualization of the numerical simulation. a Snapshot of the simulation at t ≈ 93 s. Vertical lines are magnetic field lines of the flux tube, with colours denoting the strength of the local rotating speed vr. Red-white vertical backgrounds represent the background plasma density in the simulation. The bottom layer shows part of the SOT FG-blue photospheric intensity observations at 06:03:04 UT when a swirl was detected at the centre of the layer in the intergranular lane. b–d are the time-distance plots of a perpendicular slit along the z direction located close to the tube centre. vz and δBa represent the z-direction velocity perturbation and azimuthal magnetic field perturbation, respectively. We find three different pulse fronts in the vz perturbation, and they travel at local sound (dash-dotted curve), Alfvén (solid curve) and tube (dashed curve) speed, respectively. However, only the Alfvén pulse causes both obvious perturbations in vr and δBa. No wave train can be found because of the short life (20 s) of the driver. Source data of b–d are provided in the Source Data file

