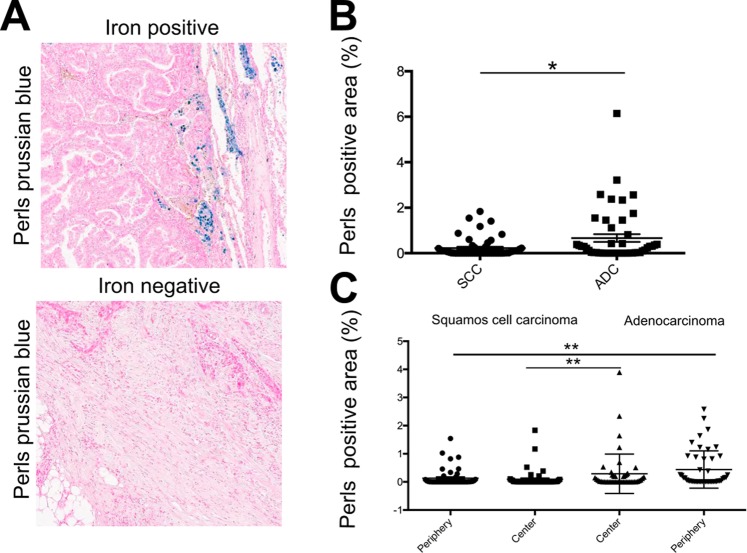
Figure 2.
Adenocarcinoma accumulated more iron in the tumor microenvironment than squamous cell carcinoma. (A) Example of Perls’ iron staining for an iron positive and an iron negative sample (blue stain represents iron positive areas). (B) Comparison of the iron content (tumor center and periphery) in squamous cell carcinoma (SCC) on the left (n = 53) and adenocarcinoma (ADC) on the right (n = 49). (C) Comparison of the iron content in the tumor center, and the tumor periphery of ADC (n = 49) and SSC (n = 53), respectively. Perls positive area represents the relative amount (in percent) of iron positive staining. Statistical tests performed are Mann-Whitney U test and Wilcoxon test. Data is shown as mean ± SEM. *p < 0.05, **p < 0.01, ***p < 0.001, ****p < 0.0001.

