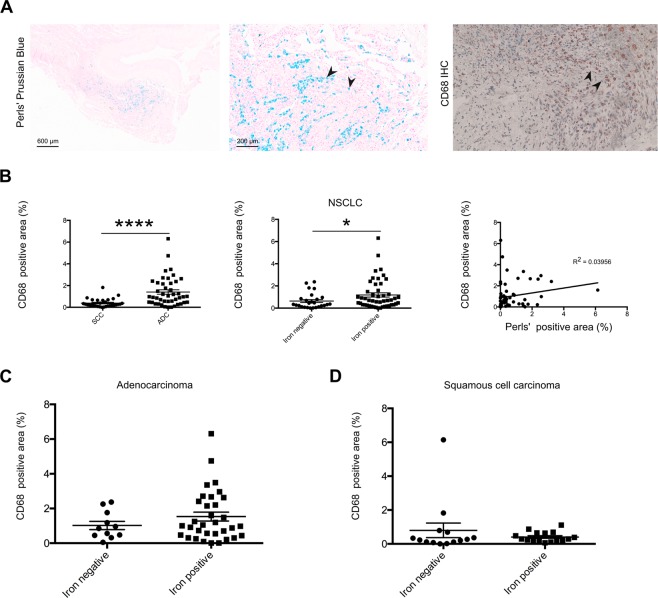
Figure 3.
Higher numbers of tumor associated macrophages were detected in tumor periphery of adenocarcinoma compared to squamous cell carcinoma. (A) Representative examples of the staining methodologies applied showing spatial connection between CD68 positive macrophages and iron positive cells (provided example shows lung adenocarcinoma). Blue staining indicates iron and red staining indicates CD68 positive cells. Arrowheads indicated in the middle and the left show staining of positive cells. (B, left) Quantification of CD68 immunohistochemistry staining in lung tumor tissue samples of adenocarcinoma (n = 44) and squamous cell carcinoma (n = 30). (B, center) Comparison of the macrophage content of iron positive (n = 48) and iron negative (n = 26) tissue samples of NSCLC patients. (B, right) Linear regression of iron content and CD68 positive macrophage content. (C) Quantification of CD68 immunohistochemistry staining in lung tumor tissue samples of adenocarcinoma and comparison between the iron positive (n = 33) and iron negative (n = 11) samples. (D) Quantification of CD68 immunohistochemistry staining in lung tumor tissue samples of squamous cell carcinoma and comparison between the iron positive (n = 16) and iron negative (n = 14) samples. CD68 positive area represents the relative amount (in percent) of positive staining. Statistical tests performed are Mann-Whitney U test and linear regression. Data is shown as mean ± SEM. *p < 0.05, **p < 0.01, ***p < 0.001, ****p < 0.0001.

