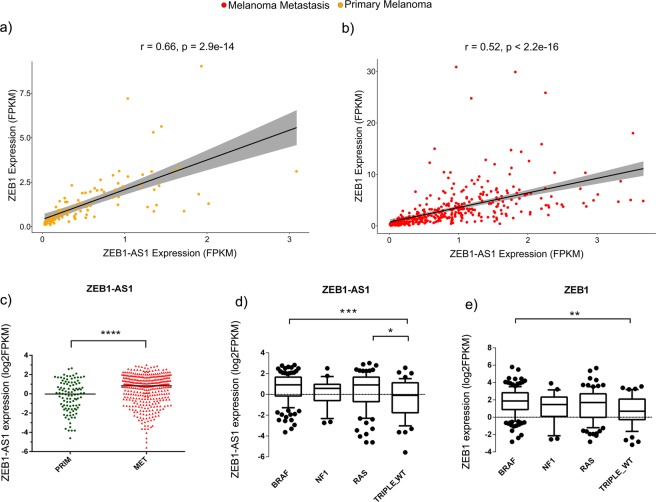
Figure 3.
Analysis of ZEB1 and ZEB1-AS1 gene expression in TCGA melanoma samples. (a,b) High positive correlation between ZEB1 and ZEB1-AS1 expression in primary melanoma and metastatic melanoma samples, respectively. Analysis from Pearson’s statistical test. Grey band represents the confidence interval. (c) Graph showing higher expression of ZEB1-AS1 in metastatic melanoma compared to primary melanoma samples from SKCM TCGA. T-test analysis was used. (d,e) Boxplot showing expression levels of ZEB1-AS1 or ZEB1, respectively, across different mutational groups of melanoma. Statistics based on ANOVA test. P-values statistical significance labels: *P ≤ 0.05, **P ≤ 0.01, ***P ≤ 0.001, ****P ≤ 0.0001.

