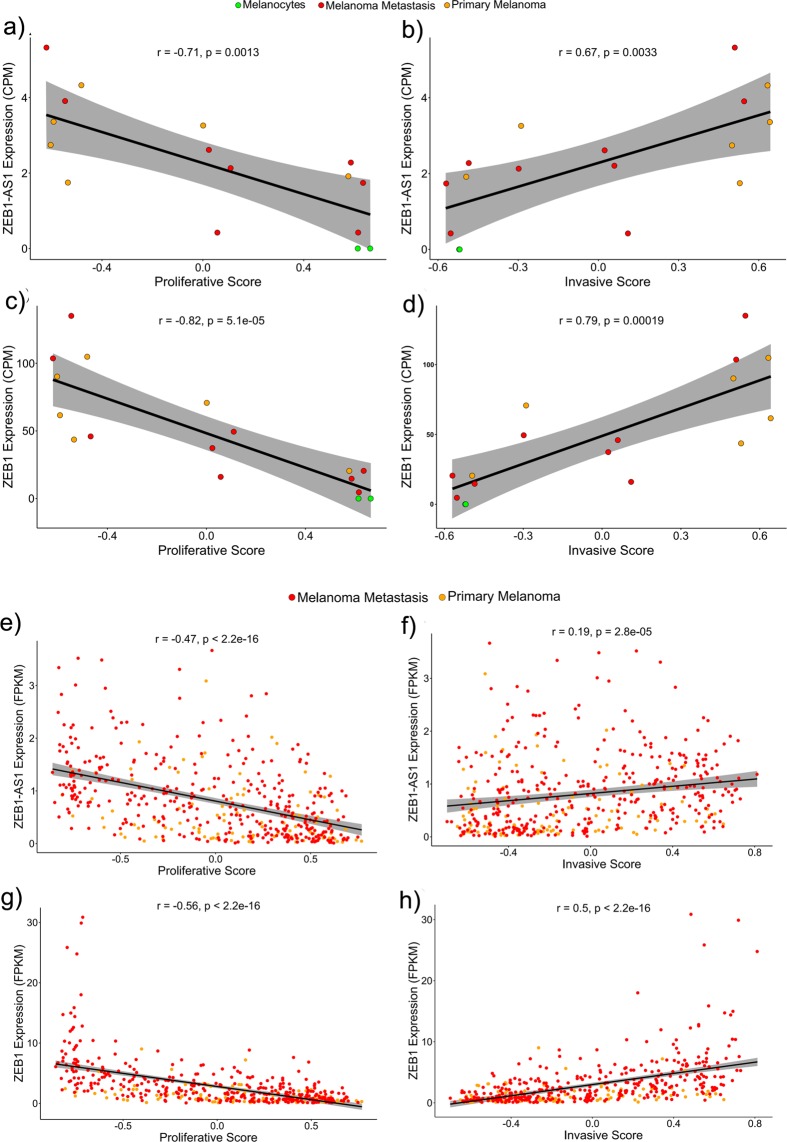
Figure 4.
ZEB1 and ZEB1-AS1 association with the invasive phenotype. (a,c) Correlation plots showing a negative correlation between ZEB1-AS1 or ZEB1 expression levels with melanocytic cell lines proliferative score, respectively. (b,d) Correlation plots showing a positive correlation of ZEB1-AS1 or ZEB1 expression levels with melanocytic cell lines invasive score, respectively. (e,g) Correlation plots showing a negative correlation between ZEB1-AS1 or ZEB1 expression levels with proliferative score in SKCM TCGA samples, respectively. (f,h) Correlation plots showing a positive correlation between ZEB1-AS1 or ZEB1 expression levels with an invasive score in SKCM TCGA samples, respectively. Grey band corresponds to the confidence interval.

