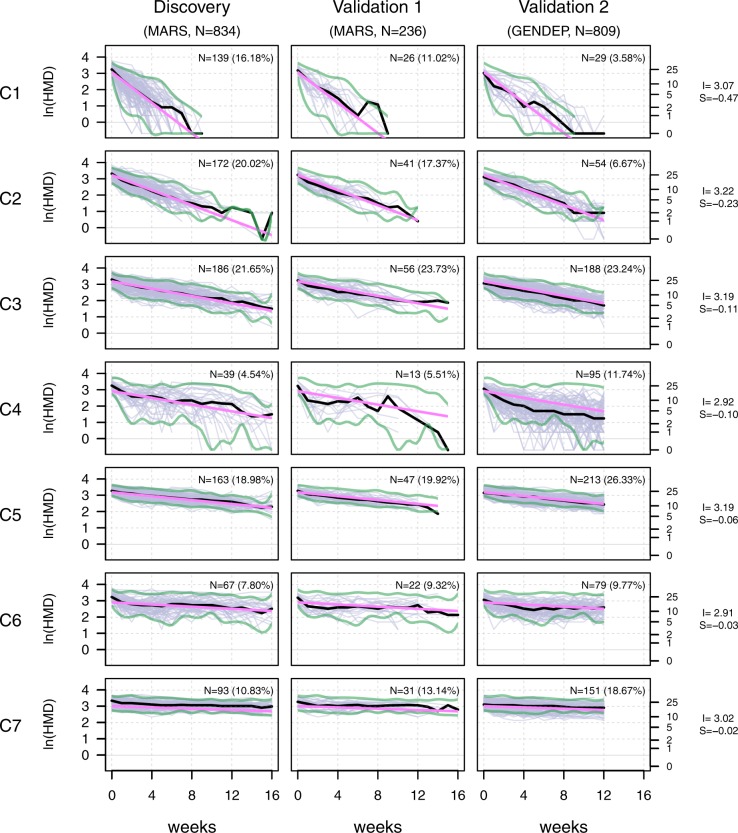
Fig. 1. Resulting cluster shape characteristics and underlying natural logarithm-transformed HAM-D courses for the discovery sample and both validation samples.
X-axis: observation time in weeks; Y-axis: natural logarithm-transformed HAM-D values (purple: raw values, black: cluster-specific median, pink: model-based linear fit). Slope and intercept values of all clusters are given on the right. Clusters are sorted from C1 to C7 according to the cluster-specific slope. Absolute and relative cluster sizes in all samples are given within the subplots. Green borders represent the limits in which 95% of HAM-D values of the discovery sample were contained. These were transferred to columns 2 and 3 to allow for comparison with the validation samples. S slope, I intercept, ln natural logarithm-transformed

