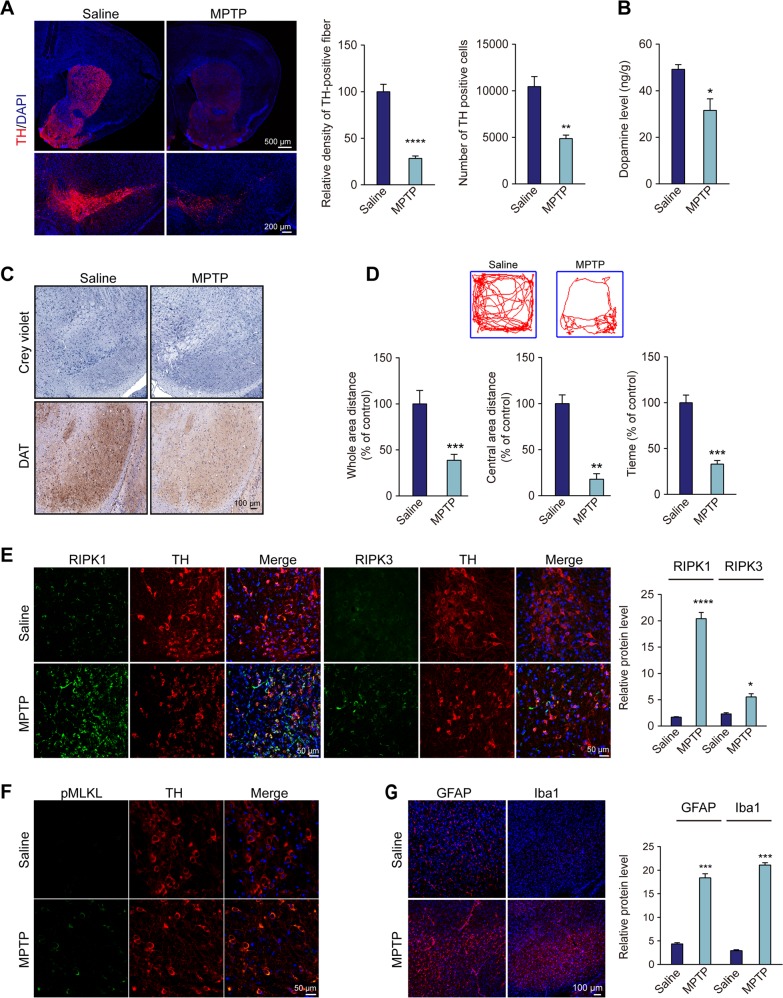
Fig. 1. Cellular localization and RIPK1 upregulation in the SNpc in the MPTP mouse model.
a Immunofluorescence for TH in the striatum (upper panel) and SNpc (lower panel) of MPTP mice. Quantification of TH-positive neuronal fibers in the striatum and TH-positive neurons in the SNpc. b Quantification of dopamine in the striatum by HPLC. c Immunohistochemistry for cresyl violet-positive cells and dopamine transporter (DAT) in the SNpc. d Motor behavior in the open field in the MPTP-induced mouse model. Representative tracks of mice in the open field chamber over 5 min. Whole-area distance and central-area distance were measured. Motor behavior on the rotarod tests in the MPTP-induced mouse model. Time spent on the rotarod was measured. e Representative images and quantification of immunofluorescence for RIPK1 and RIPK3 in dopaminergic neurons. f Immunohistochemistry for phosphorylated MLKL (pMLKL) in dopaminergic neurons. g Representative confocal micrographs of Iba1 and GFAP staining in the SNpc. All data represent the mean ± SEM. Student’s t test, *P < 0.05, **P < 0.01, ***P < 0.001, and ****P < 0.0001

