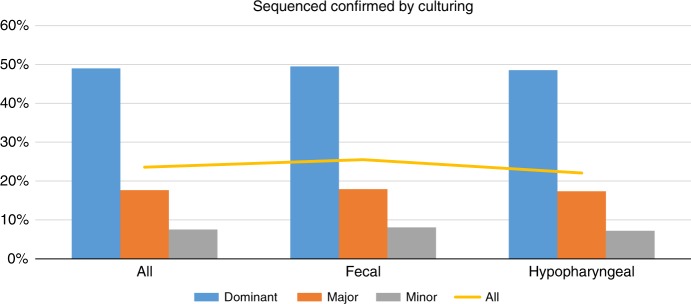
Fig. 2.
Barplot showing the percentage of bacteria identified by amplicon sequencing that were also identified by TCM in the same sample. The three groups of bars (x-axis) show the result for the different sample types (all together or fecal and hypopharyngeal samples separately). Blue bars show the result for dominant bacteria (abundance >10%), orange show major bacteria (1–10%), and gray show minor bacteria (<1%), while the yellow line indicates the overall percentage for each sample type

