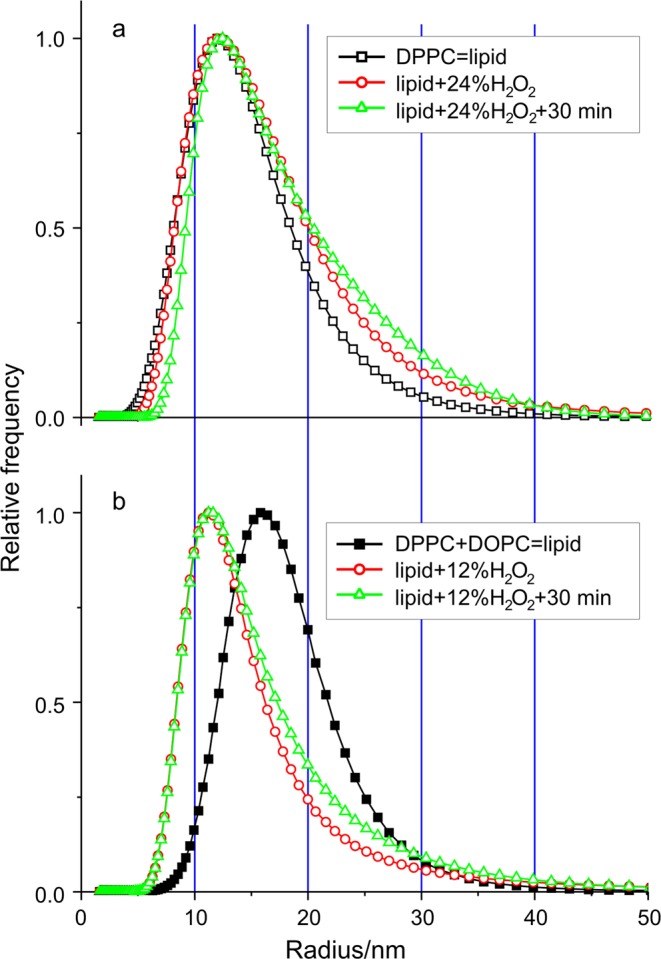
Figure 4.

Verification of the membrane disrupting effect of H2O2 as ROS is added to two different combinations of liposome samples measured by dynamic light scattering (DLS). (a) Relative frequency distributions of the liposome radius of monocomponent DPPC sample without and with 24% (m/m) H2O2 added furthermore the distribution in 30 min after the ROS addition. Curves are normalized to the height for easier comparison. (b) The same kind of distributions of DPPC80 + DOPC20 sample without and with 12% (m/m) H2O2 added furthermore the distribution in 30 min after the ROS addition. (SUV preparation method 1).
