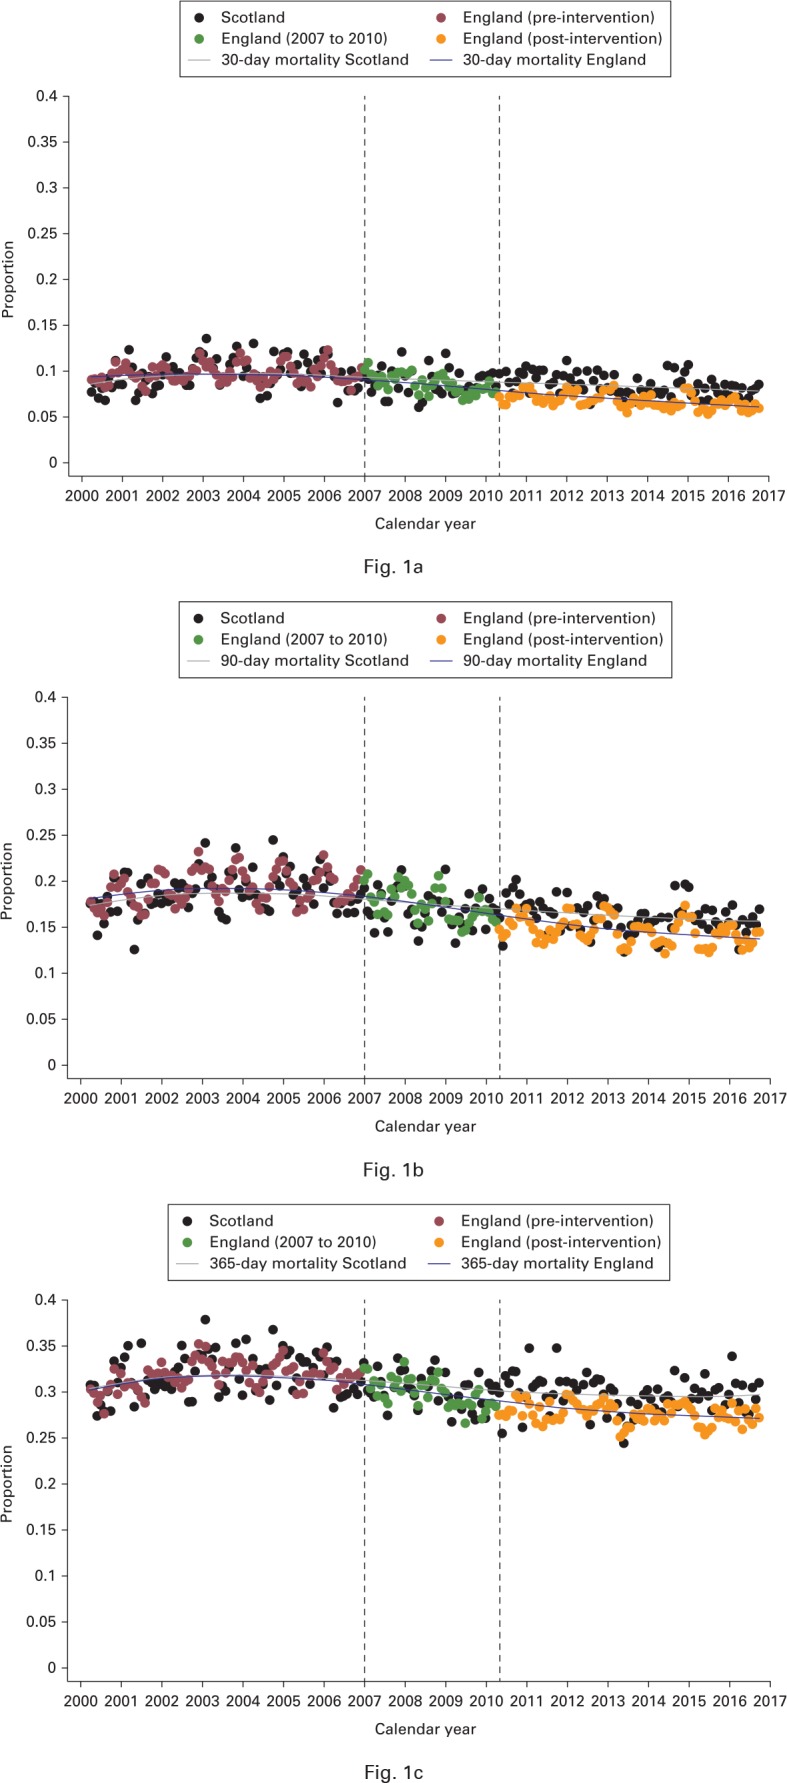
Fig. 1.

Charts showing monthly changes in a) 30-, b) 90- and c) 365-day mortality among adults aged more than 60 years, 2000 to 2016. Dashed lines represent introduction of the National Hip Fracture Database in January 2007 and the Best Practice Tariff in April 2010.
