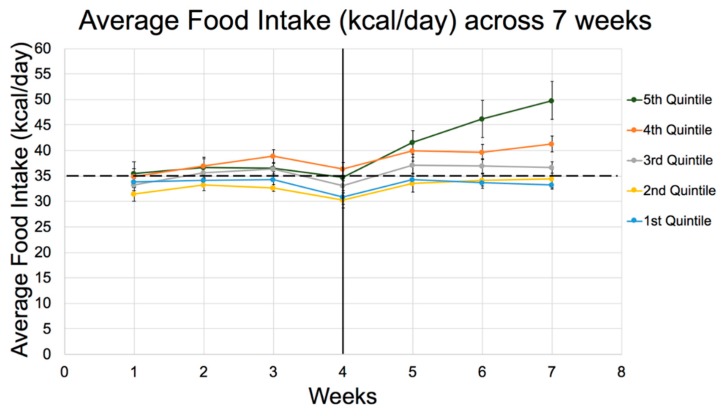
Figure 2.
Average Food Intake (kcal/day) for 7weeks on Diet 73 (70:10:20, CHO:fat:protein % energy) by quintiles in Experiment 3. Dotted line represents the average food intake threshold per day (35 kcal/day), exceeded only by Q4 and Q5. The dip in food intake at 4 weeks reflects the stress as a result of OGTT conducted that week. See Table 5 for detailed differences between quintiles apparent from week 1.

