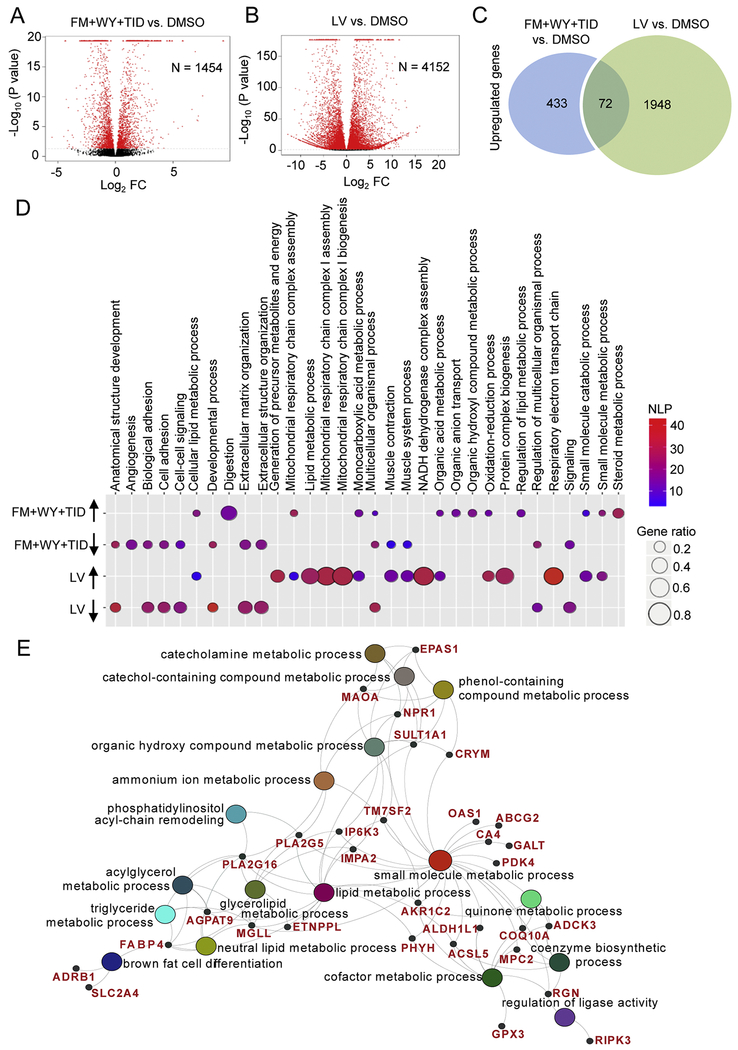
Figure 6.
Treatments of 3D cardiac spheres with a HIF-1α inhibitor, a PPARα activator and the postnatal factors (T3, IGF-1 and dexamethasone) alter gene expression. Volcano plots portray log2 fold change (FC) vs. −log10(P value) for differentially expressed genes in hiPSC-CMs treated with (A) FM+WY+TID and (B) tissues from human left ventricle (LV) compared with DMSO-treated hiPSC-CMs. The red dots denote significantly regulated genes (P<0.02); N indicates the number of differentially expressed genes. (C) Venn diagram showing the number of significantly up-regulated genes in FM+WY+TID-treated hiPSC-CMs vs. DMSO-treated hiPSC-CMs and LV vs. DMSO-treated hiPSC-CMs (P<0.002). (D) Bubble plot showing the enrichment analysis of differentially expressed genes in hiPSC-CMs treated with FM+WY+TID and LV compared with DMSO-treated hiPSC-CMs. Colors of displayed circles indicate the levels of significant enrichment of the gene ontology terms (GO terms) according to negative log10(P value) (NLP). The area of displayed circles corresponds to Gene_ratio which is the ratio of genes enriched within each GO term. (E) Genes within the identified GO terms that are commonly upregulated in hiPSC-CMs treated with FM+WY+TID and LV compared with DMSO-treated hiPSC-CMs. FM, FM19G11; WY, WY-14643; TID, T3 + IGF-1 + dexamethasone.

