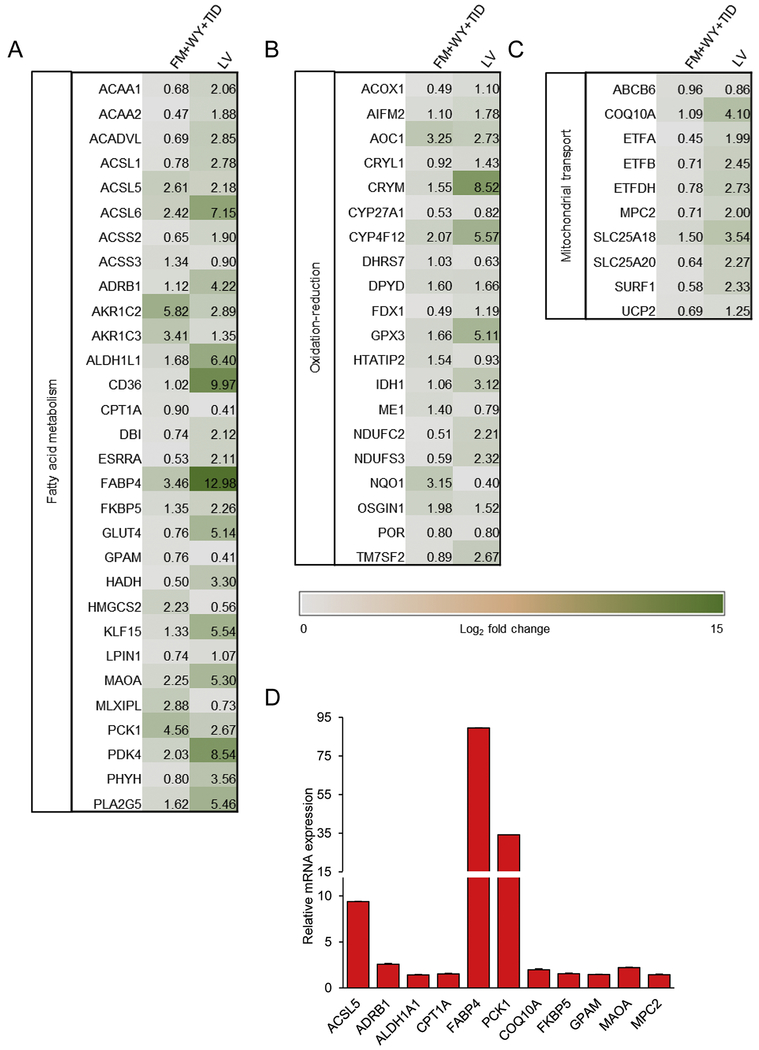
Figure 7.
Fold changes of significantly upregulated targets that are common in both FM+WY+TID-treated hiPSC-CMs vs. DMSO-treated hiPSC-CMs and LV vs. DMSO-treated hiPSC-CMs. Heat map showing upregulated genes that are categorized according to biological processes; (A) fatty acid oxidation, (B) oxidation-reduction, and (C) mitochondrial transport. Data are presented as Log2 fold change expression relative to mean for all conditions (n=3). (D) Quantitative measurement of gene expression in FM+WY+TID-treated hiPSC-CMs relative to those in DMSO-treated hiPSC-CMs was validated with qRT-PCR. Data are presented as mean ± SEM (n=3). FM, FM19G11; WY, WY-14643; TID, T3 + IGF-1 + dexamethasone.

