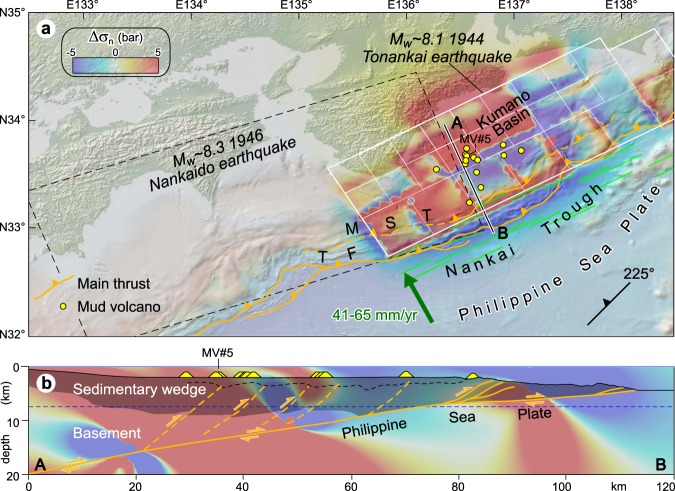
Figure 2.
(a) Normal stress changes (Δσn; bar, fault unclamping positive) produced by the 1944 Tonankai earthquake (finite fault model from Baba et al.32; see also Fig. S1 and Supporting Information). Seismic source (white box), rectangular sub-faults (white cells) and their surface projection (green lines) are indicated. Small yellow circles indicate mud volcanoes in the Kumano Basin (after Pape et al.6; Morita et al.29). The Kumano Basin is almost entirely located above the 1944 fault rupture. Stress changes are resolved on thrust faults (strike = 225°, dip = 40°, rake = 90), which are inferred to control the mud volcano systems in the Kumano Basin. The rupture area of Kato & Ando31 for the 1946 Nankaido earthquake (dashed black line) is shown for reference. TF, thrust front; MST, megasplay thrust. (b) Vertical cross section of normal stress changes superposed onto the Nankai subduction margin (simplified from Park et al.30). Both the sedimentary wedge (indicated by gray shading) and the underlying ‘basement’, which collectively indicates dominant igneous and metamorphic rocks (island arc upper crust; Marcaillou et al.70), are indicated. Deep-sourced fluids emitted from mud volcano MV#5 are inferred to travel upward along a thrust fault rooted in the subduction interface8. A convenient range of stress change values (−5, 5 bar) has been arbitrarily chosen; note that in some models the calculated stresses may exceed this range. In horizontal section a stress is sampled at 7.5 km depth (dashed blue line in b). This figure was generated using the Coulomb 3.4 software (https://earthquake.usgs.gov/research/software/coulomb) and Adobe Illustrator CS3 (https://www.adobe.com).

