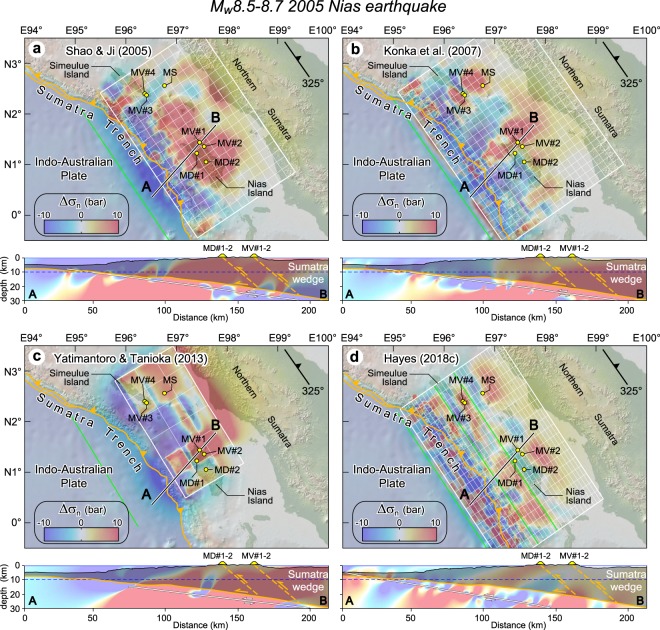
Figure 4.
Normal stress changes (Δσn; bar, fault unclamping positive) produced by the Mw ~ 8.5–8.7 2005 Nias earthquake considering different finite fault models: (a) Shao & Ji39, (b) Konca et al.40, (c) Yatimantoro & Tanioka41, and (d) Hayes42 (symbols are as those in Fig. 2). A depth cross section is shown in the bottom panel of each source fault model. Small yellow circles indicate different types of subaerial and seafloor methane seeps. Normal stress change patterns are superposed onto the Sumatra accretionary wedge (the latter is indicated by gray shading), which includes undifferentiated igneous and sedimentary rocks, as well as a mantle wedge and slivers of oceanic crust (adapted after Singh et al.43). A convenient range of stress change values (−10, 10 bar) has been arbitrarily chosen; note that in some models the calculated stresses may exceed this range. The thick white lines in cross sections indicate the source fault considered in the respective finite fault model. In horizontal sections stress is sampled at 10 km depth (dashed blue line in vertical cross sections). This figure was generated using the Coulomb 3.4 software (https://earthquake.usgs.gov/research/software/coulomb) and Adobe Illustrator CS3 (https://www.adobe.com).

