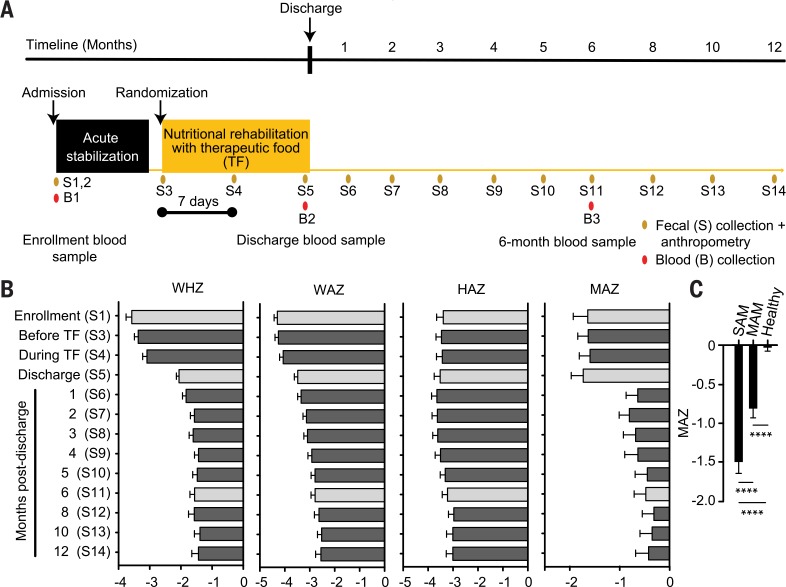
Fig. 1.
Longitudinal study of Bangladeshi children with SAM treated with therapeutic foods. (A) Study design. (B) Anthropometry and MAZ scores. Gray bars represent the three time points at which blood samples were collected. (C) Summary of MAZ scores for children with SAM (WHZ < –3; n = 96 fecal samples) and subsequently (post-SAM) MAM (WHZ > –3 and <–2; n = 151 fecal samples), plus healthy children aged 6 to 24 months living in the same area in which the SAM study was conducted (n = 450 fecal samples). Mean values for WHZ, WAZ, HAZ, and MAZ ± SEM are plotted on the x axes of (B) and (C). ****P < 0.0001 (one-way ANOVA followed by Tukey’s multiple comparisons test).

