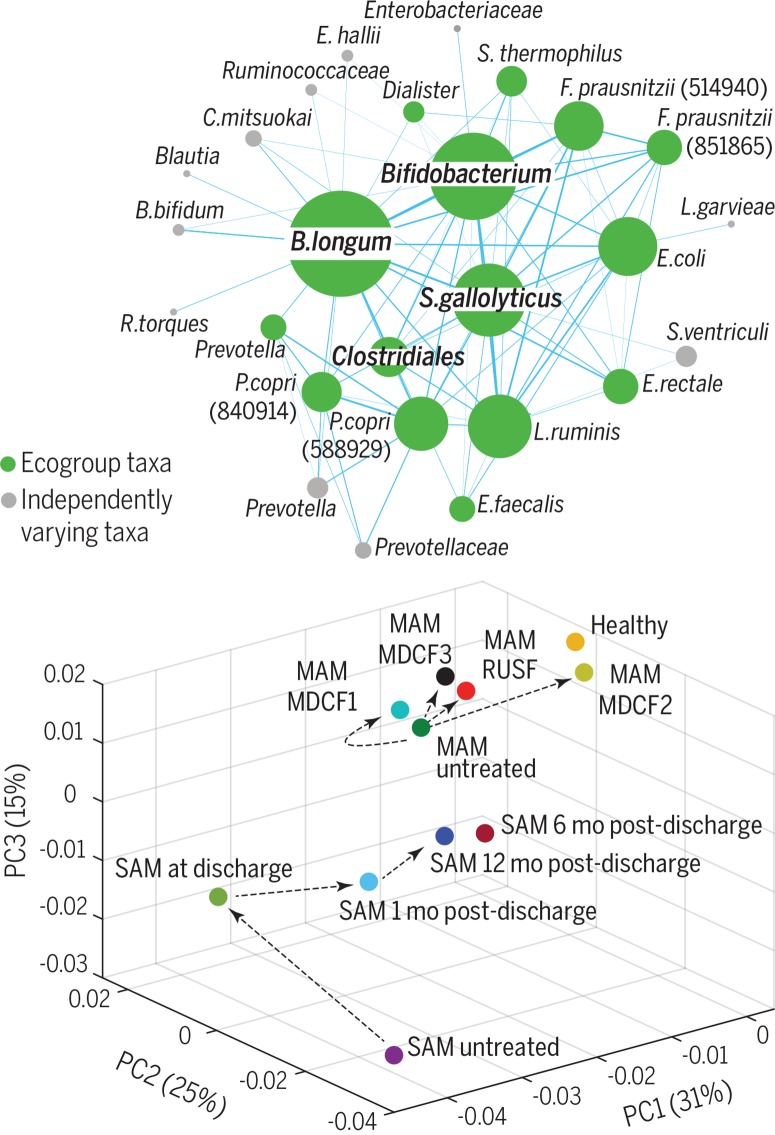
Ecogroup as a concise description of microbiota form. (Top) Network diagram of covarying taxa where node (taxon) color indicates ecogroup (green) or nonecogroup (gray), node size indicates number of mutually covarying taxa, and connection between nodes indicates covariance between two taxa. (Bottom) Measuring the representation of ecogroup taxa reveals that children with SAM treated with standard therapeutic foods have an ecogroup profile similar to that of children with untreated MAM, indicating persistent perturbations in their gut community relative to healthy children. In contrast, children with MAM treated with a therapeutic food designed to target the microbiota (MDCF-2) have an ecogroup profile that overlaps nearly entirely with that of healthy children.

An official website of the United States government
Here's how you know
Official websites use .gov
A
.gov website belongs to an official
government organization in the United States.
Secure .gov websites use HTTPS
A lock (
) or https:// means you've safely
connected to the .gov website. Share sensitive
information only on official, secure websites.
