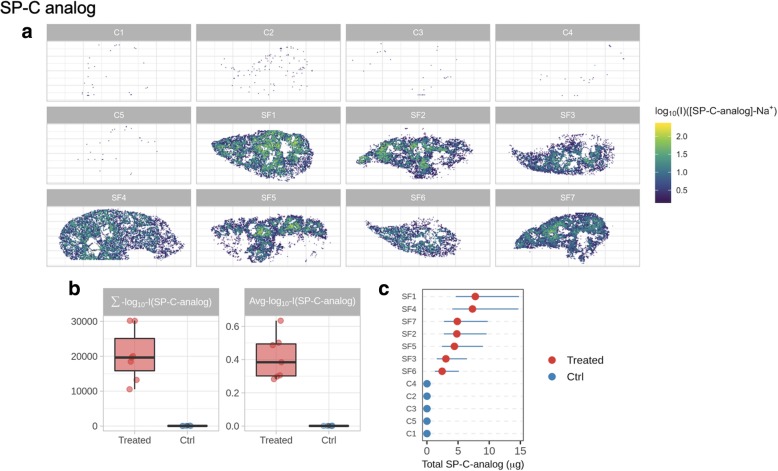
Fig. 5.
a Reconstructed spatial distribution images of the SP-C analog in the lungs of surfactant-treated (SF) and untreated control (C) animals. b Boxplots showing the difference of MSI-derived parameters (the log10 average intensity of ion inside the lung tissue section, Avg_log10_I; and the absolute signal of the ion in the lung section from those pixels with a signal above the noise level, Σ_log10_I) in control (Ctrl) and surfactant-treated animals. Quantification results for SP-C analog (c). Blue, horizontal lines in quantification charts identify the 95% confidence intervals

