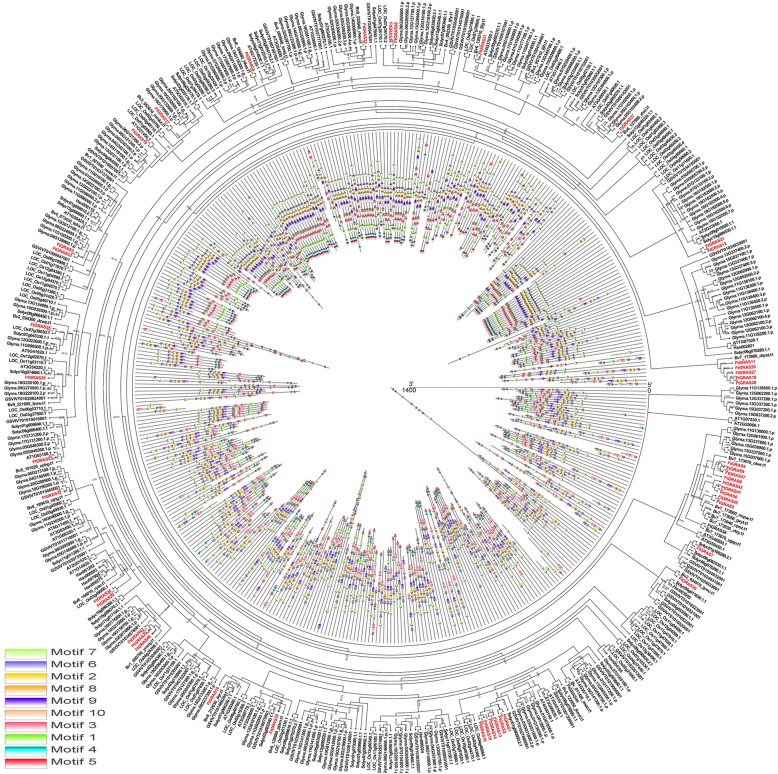
Fig. 5.
Phylogenetic relationships and motif compositions of GRAS proteins from eight different plant species. The GRAS genes from Tartary buckwheat and other plant species are marked in red and black, respectively. The percentages beside all branches are bootstrap support values generated from 1000 replicates. The motifs, numbered 1–10, are displayed in different colored boxes. The sequence information for each motif is provided in Additional file 4: Table S2

