Fig. 1.

Motivations for volunteering in the reception center
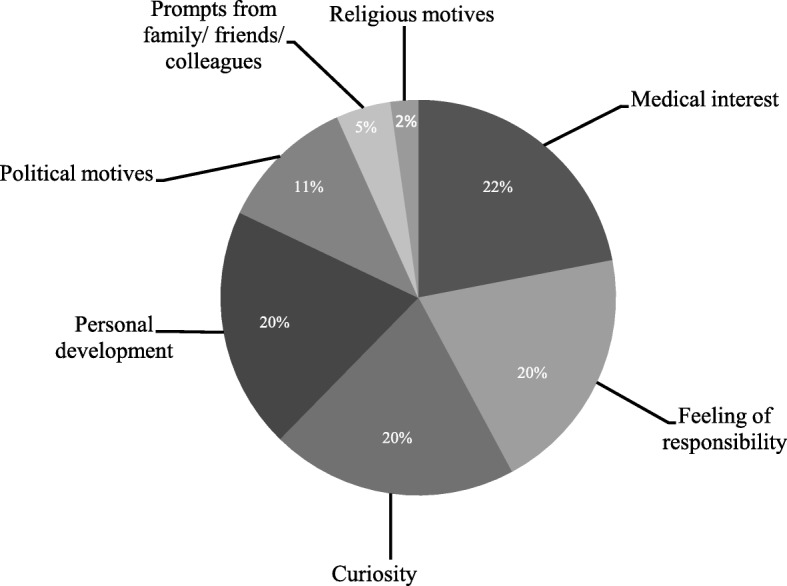
The pie chart depicts the various proportions of main motivations of the n = 62 medical students.

Motivations for volunteering in the reception center
The pie chart depicts the various proportions of main motivations of the n = 62 medical students.