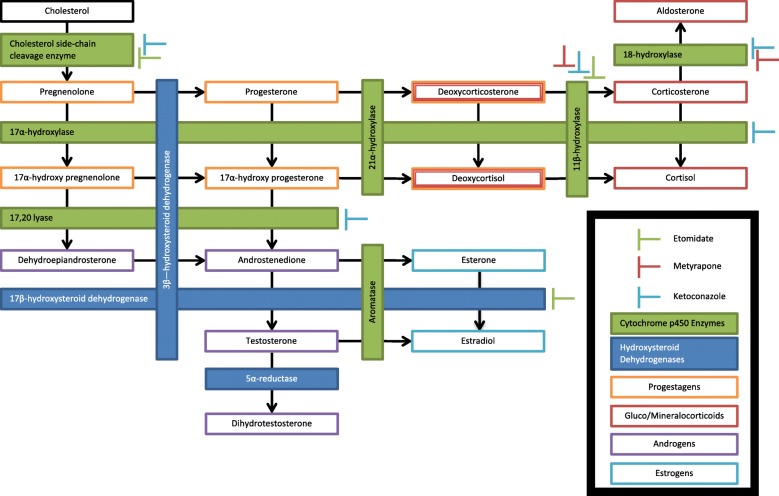
Fig. 1.
A graphic representation of the steroidogenic pathways. As indicated in the figure inset, filled boxes represent enzymes, with green and blue boxes indicating cytochrome P450 and hydroxysteroid dehydrogenase superfamily enzymes, respectively. Orange boxes indicate progestogens whereas dark red boxes indicate the gluco- and mineral-corticoids. Purple and light blue boxes indicate androgens and estrogens, respectively. The proposed inhibitory sites of common steroidogenesis inhibitors are shown with green, red, and light blue bars, representing etomidate, metyrapone, and ketoconazole, respectively

