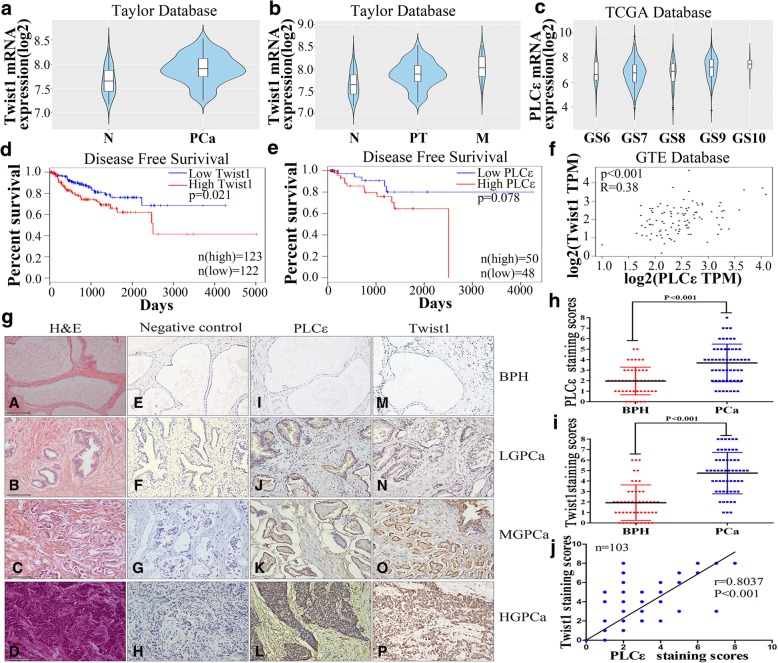
Fig. 1.
High expression levels of PLCε and Twist1 in PCa tissues. a RNA-seq mRNA expression data from the GEO database (GSE21034) was used to compare Twist1 expression between in PCa tumors (PCa) and their non-tumor counterparts (N). * p < 0.05. b Violin plots depicting the expression of the gene of interest among non-tumoral (N), primary tumor (PT) and metastatic (M) PCa specimens in GEO database. c Violin plots depicting the expression of the gene of interest among PCa specimens of the indicated Gleason grade in TCGA Database. d, e Disease free survival curves of PCa patients according to Twist1 and PLCε mRNA levels. f Correlation between the expression of Twist1 and PLCε in PCa patients from GTEx database. g Representative haematoxylin and eosin (H&E) staining and IHC staining in 55 PCa tissue samples and 48 BPH samples. Magnification × 400. Bars = 100 μm. H&E staining of prostate tissues were showed (A-D). PBS served as negative control in IHC staining (E-H). Representative IHC staining of different staining intensities used as criteria in staining scoring: none staining was observed in BPH (I, M), mild staining in low-grade (LG) PCa (J, N), moderate staining in middle-grade (MG) PCa (K, 0), and strong staining in high grade (HG) PCa (L, P). h, i Average staining scores for PLCε and Twist1 expression in prostate tissues. Data were represented as the means ± SD. j The correlation with PLCε and Twist1 in prostate tissues samples was analyzed by Pearson analysis

