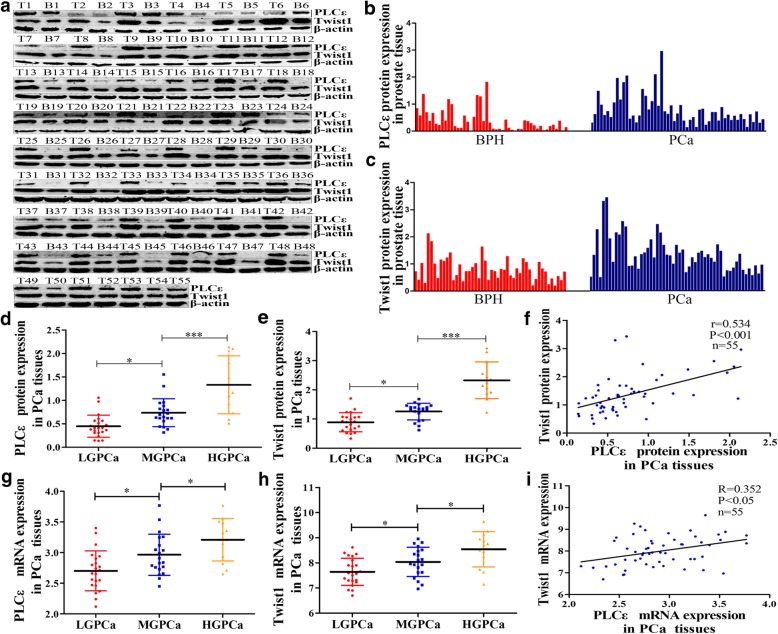
Fig. 2.
A association between PLCε and Twist1 expression in PCa patients. a PLCε and Twist1 protein expression in 55 PCa tissue samples (T) and 48 BPH samples (B) were assayed by western blotting analysis. b, c PLCε and Twist1 protein expression in tissues were quantified as mean optical density. d, e Average PLCε and Twist1 protein expression of different grades PCa. f Correlation curve of PCa PLCε protein versus corresponding Twist1. g, h Average PLCε and Twist1 mRNA expression of different grades PCa. i Correlation curve of PCa PLCε mRNA versus corresponding Twist1. Data were represented as the means ± SD. *P < 0.05, **P < 0.01

