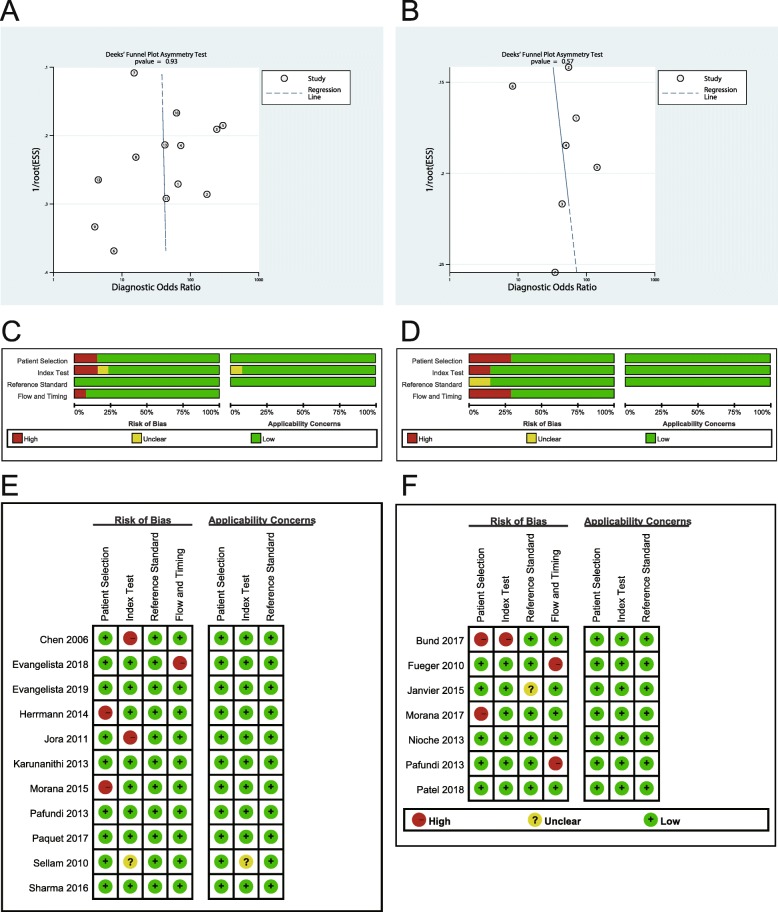
Fig. 2.
Publication bias assessment of included studies (a, b) and quality assessment of included studies (c-f). a, b: Deeks’ Funnel Plot shows no publication bias in both detecting (a) and grading (b) gliomas. c-f: The graphs show risk of bias and applicability concerns regarding each study. Quality assessment result for diagnosis (c, e); for grading (d, f)

