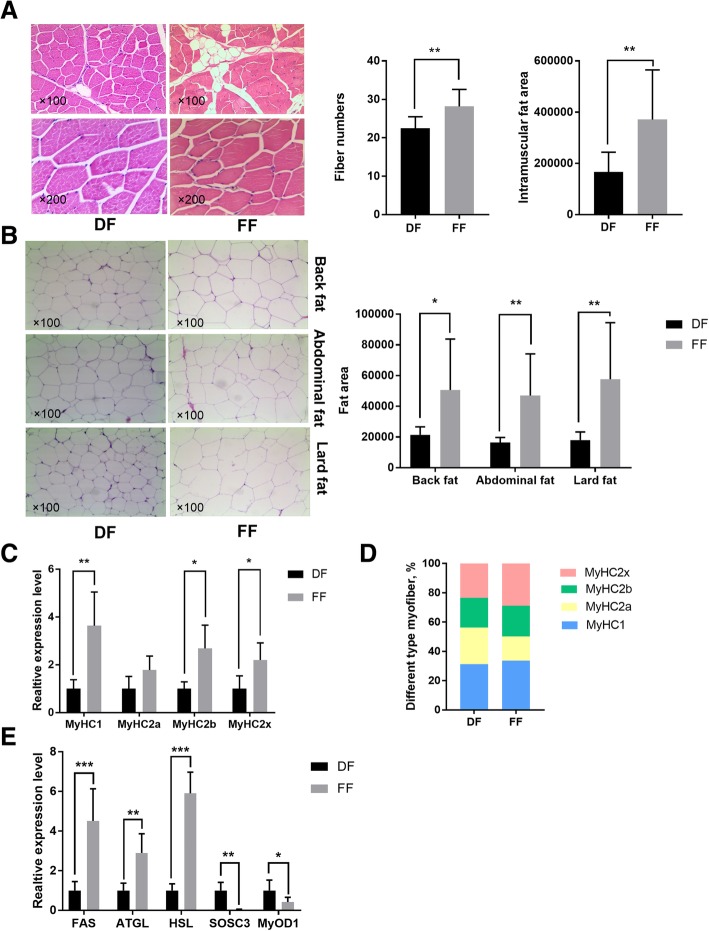
Fig. 1.
Fibre number and the intramuscular fat area of longissimus dorsi muscles in the DF and FF groups (a). Back, abdominal and lard fat area of pigs in the DF and FF groups (b). Gene expression of MyHC1, MyHC2a, MyHC2b and MyHC2x of pigs in the DF and FF groups (c). Myofiber type as indicated by the percentage of different MyHC in the longissimus dorsi muscles of pigs in the DF and FF groups (d). Gene expression of the fat deposition and meat quality of longissimus dorsi muscles in the DF and FF groups (e). * represents significant difference (p < 0.05), and ** represents significant difference (p < 0.01)

