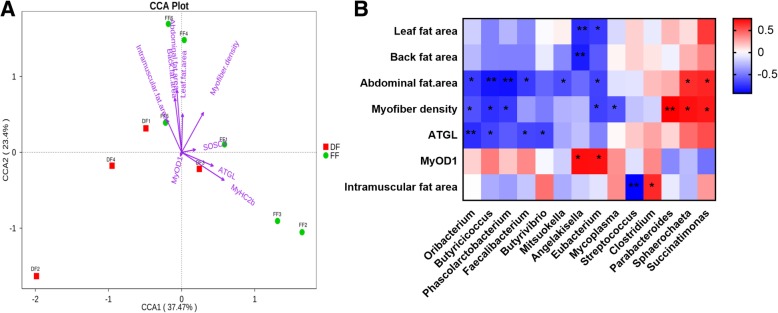
Fig. 3.
Multi canonical correlation analysis of the relative abundance of the genus in pig feces samples and environmental parameters. Environmental parameters include myofiber density, leaf fat area, abdominal fat area, back fat area, intramuscular fat area, MyOD1 mRNA and ATGL mRNA. Arrow lengths indicate the strength of the relationship between the environmental parameters and the overall microbial community (a). Heat maps of Spearman’s rank correlation coefficients between the myofiber density, leaf fat area, abdominal fat area, back fat area, intramuscular fat area, MyOD1 mRNA, ATGL mRNA and the relative abundance of bacterial genus (b). The correlation abundant coefficients are indicated by color, * represents significant correlation (p < 0.05), and ** represents significant correlation (p < 0.01)

