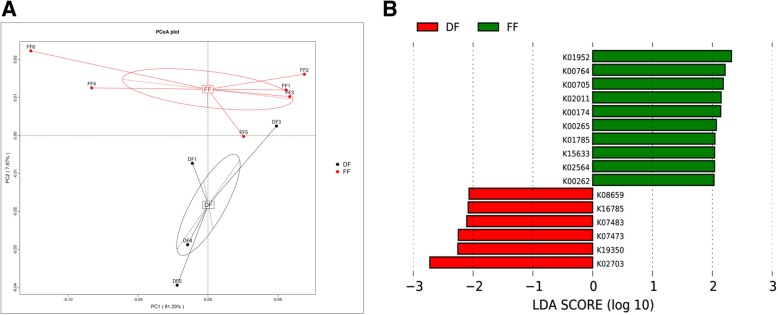
Fig. 4.
Two-dimensional principal component score plot based on the unweighted unifrac metrics for all samples. The KO (KEGG Orthology) detected in pig feces samples are shown for the DF group (black circles) and FF group (red circles) (a). Comparisons of KO level by using LefSe analysis. LDA scores indicates the significant diversity (p < 0.05) between DF group and FF group at the KO level (b)

