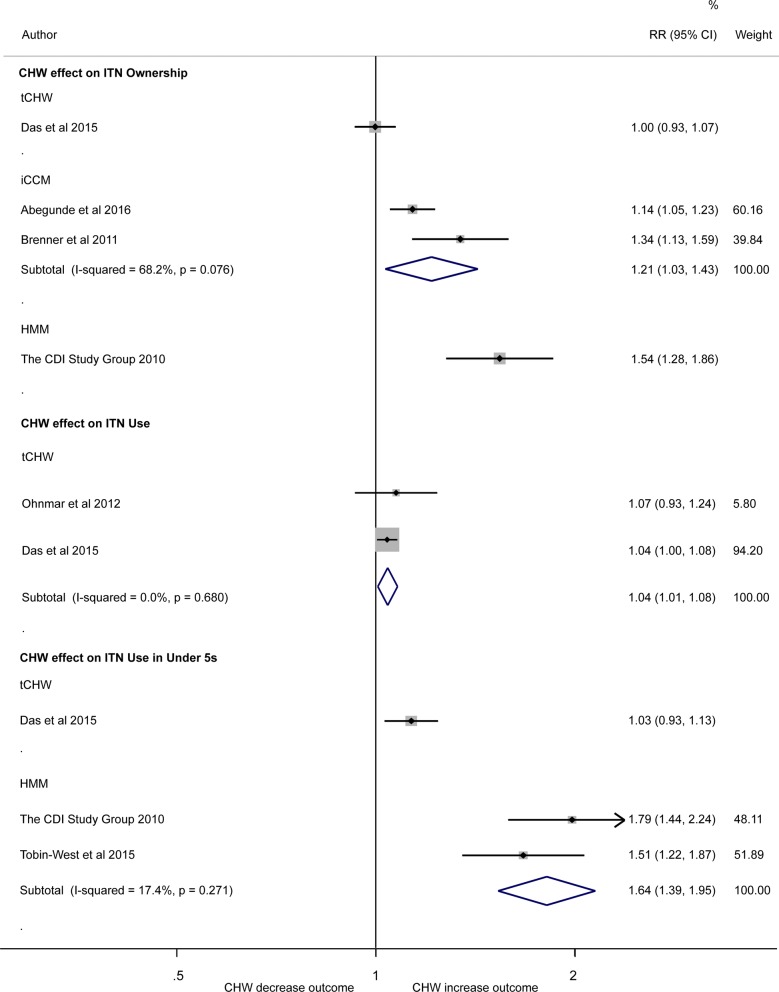
Fig. 2.
Forest plot showing the association between use of CHW and coverage of insecticide treated bed net ownership and use. Plot shows risk ratios (RR), 95% confidence intervals (95% CI) and inverse variance study weights (% weight). Pooled results were calculated by fixed-effects (I-squared ≤ 30%) or random-effects (I-squared = 31% to ≤ 75%). Estimates were calculated from data in the papers. ITN ownership is defined as a household with at least one ITN, ITN use as ITN use (the previous night) by anyone and ITN use (the previous night) by under-5 children. Please note: results were not pooled in meta-analysis across different community-delivered models quantifying the effect of community-delivered models on ITN ownership or ITN use (the previous night) by under-5 children due to the high degree of heterogeneity (I-squared = 88.6% and 93.2%, respectively)

