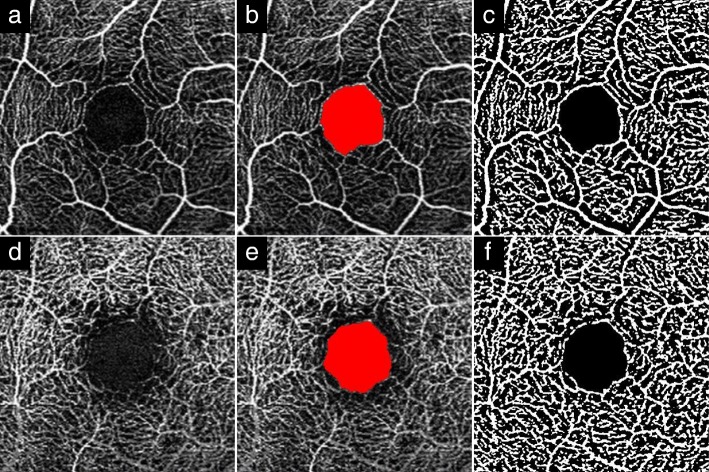
Fig. 1.
Analysis of optical coherence tomography angiography image. Typical optical coherence tomography angiography images from a patient. a; Superficial capillary plexus (SCP) image. b; Foveal avascular zone (FAZ) area in SCP (region shown in red). c; Binarized OCTA image using ImageJ in SCP. d; Deep capillary plexus (DCP) image. e; FAZ area in DCP (region shown in red). f; Binarized OCTA image using ImageJ in DCP. Vascular densities in SCP and DCP were calculated from binary images in c and f

