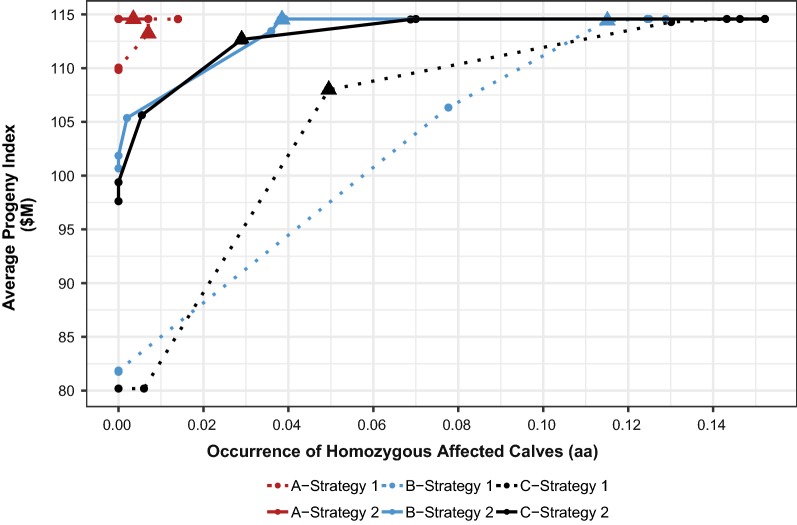
Fig. 2.
Average progeny index versus occurrence of affected calves per mating for three scenariosa given two breeding strategiesb. aScenario A (7 loci with high-frequency LOF alleles), scenario B (76 loci with low-frequency LOF alleles), and scenario C (50 with high- and low-frequency loci). bStrategy 1: Selection against carrier parents with decreased weightings (L- > R: 100, 10, 1, 0.1, 0.01, 0.001, 0) against LethalA; Strategy 2: Selection and mate allocation to avoid homozygous offspring with decreased weightings (L- > R: 100, 10, 1, 0.1, 0.01, 0.001, 0) against LethalG. Filled triangle = profit maximizing weighting for a given scenario and breeding strategy

