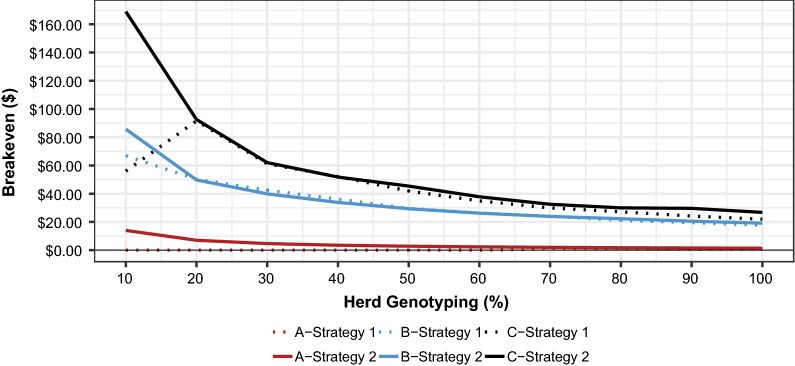
Fig. 4.
Breakeven ($/test) value of different herd genotyping percentages for three scenariosa when using two breeding strategiesb. aScenario A (7 loci with high-frequency LOF alleles), scenario B (76 loci with low-frequency LOF alleles), and scenario C (50 with high- and low-frequency loci). bStrategy 1: Selection against carrier parents (Aa); strategy 2: Mate selection to avoid homozygous offspring (aa)

