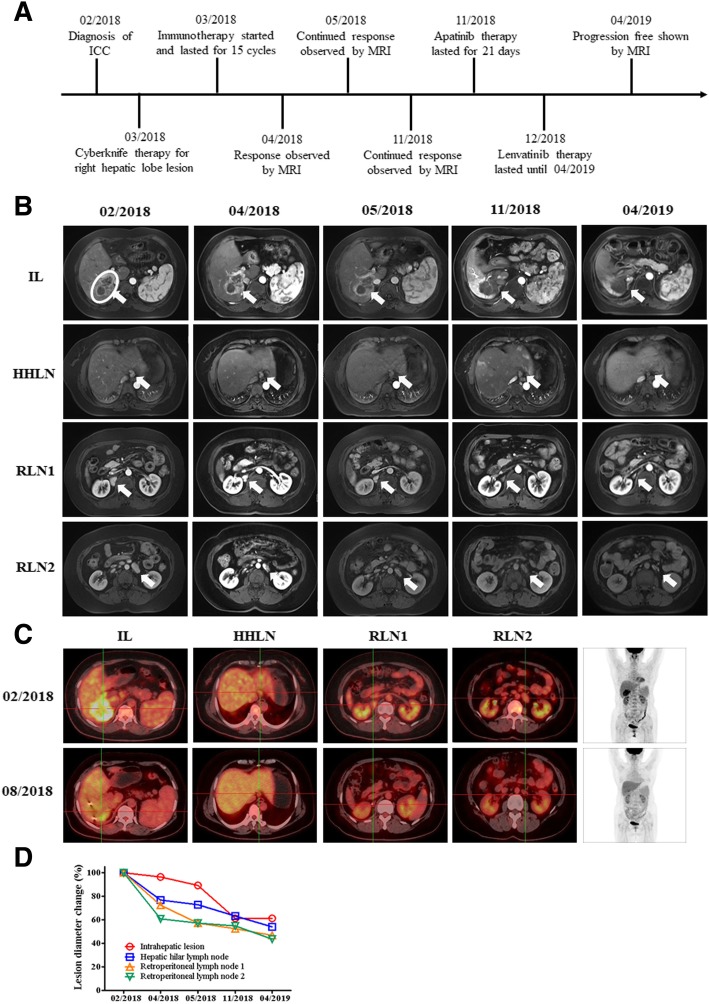
Fig. 1.
Images describing the condition and therapeutic responses of patient A. a scheme shows the time course of patient A in diagnosis the therapy. b MRI images show the therapeutic response of patients following a series of treatment. The circle indicates the target lesion/region for radiotherapy, and arrows in figures indicate the position of lesions. c PET-CT images show the therapeutic response of patients following a series of treatment. d Statistics of lesion diameter reduction for all lesions of patient A. IL: Intrahepatic lesion, HHLN: Hepatic hilar lymph node, RLN1: Retroperitoneal lymph node 1, RLN2: Retroperitoneal lymph node 2

