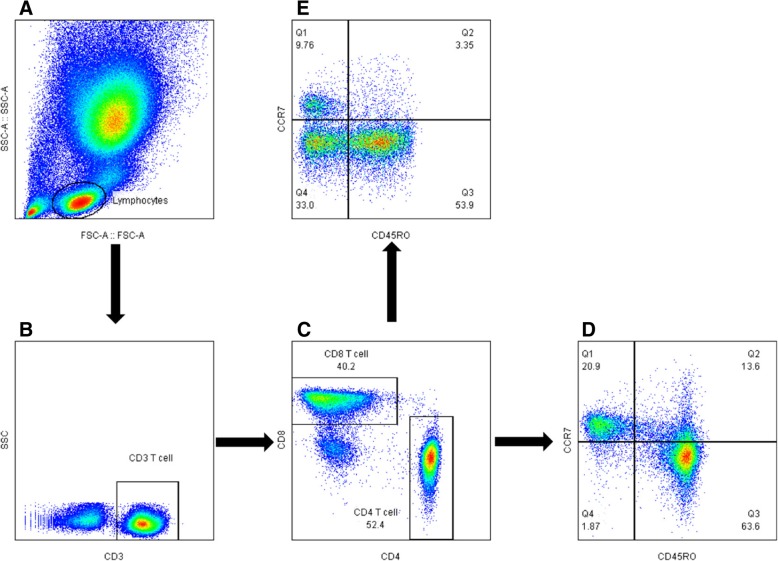
Fig. 1.
Flowchart of flow cytometry analysis to identify CD4 and CD8 T cells. a The flow cytometry picture of lysed peripheral blood including lymphocytes; b the flow cytometry picture of T cells gated from lymphocytes; c the flow cytometry picture of CD4 T cells and CD8 T cells gated from T cells; d the distribution of naïve T cells (CD45RO − CCR7+), central memory T cells (CM, CD45RO+ CCR7+), effector memory T cells (EM, CD45RO + CCR7−), EMRA (CD45RO − CCR7−) gated from CD4 T cells; e the distribution of naïve T cells (CD45RO − CCR7+), central memory T cells (CM, CD45RO+ CCR7+), effector memory T cells (EM, CD45RO + CCR7−), EMRA (CD45RO − CCR7−) gated from CD8 T cells

