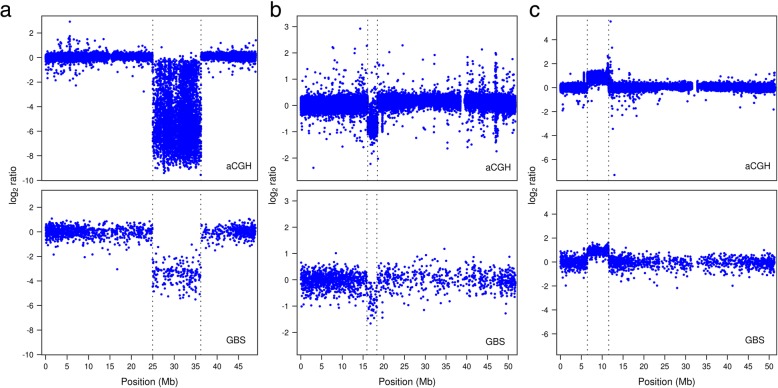
Fig. 1.
Examples of aCGH and GBS log2 ratio profiles of events detected using both methods. Vertical dotted lines mark event boundaries. The GBS log2 ratio data are those generated from the dataset used to called homozygous deletions and duplications from the first GBS library in all three cases. a log2 ratio profiles of a 11.2-Mb homozygous deletion on chromosome 14 of individual FNMN0065. b log2 ratio profiles of a 2.3-Mb hemizygous deletion on chromosome 15 of individual FNMN0039. c log2 ratio profiles of a 5.1-Mb duplication on chromosome 6 of FNMN0085. aCGH data also revealed a 50-kb duplication at around 5.6 Mb on this same chromosome; its visual signature can be seen on the GBS profile although it was not called by the automated pipeline

