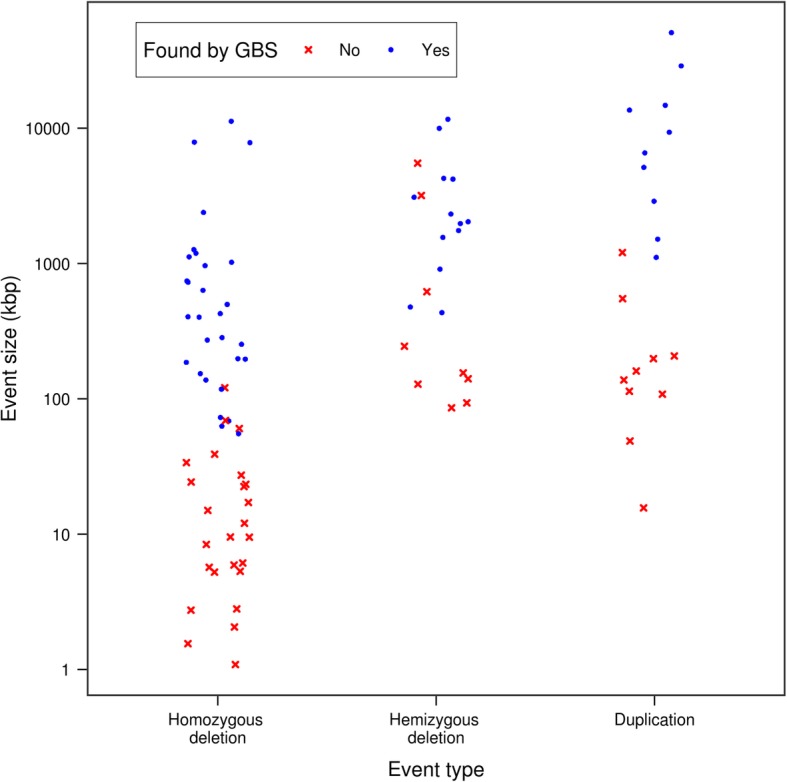
Fig. 2.

Size distribution of CNVs detected based on the aCGH data according to whether (blue dots) or not (red crosses) the GBS protocol and pipeline for calling CNVs detected them. The sizes plotted are those determined from the aCGH data. Points were jittered along the x-axis to avoid overlap between events of similar sizes. Note that the scale of the y-axis is logarithmic
