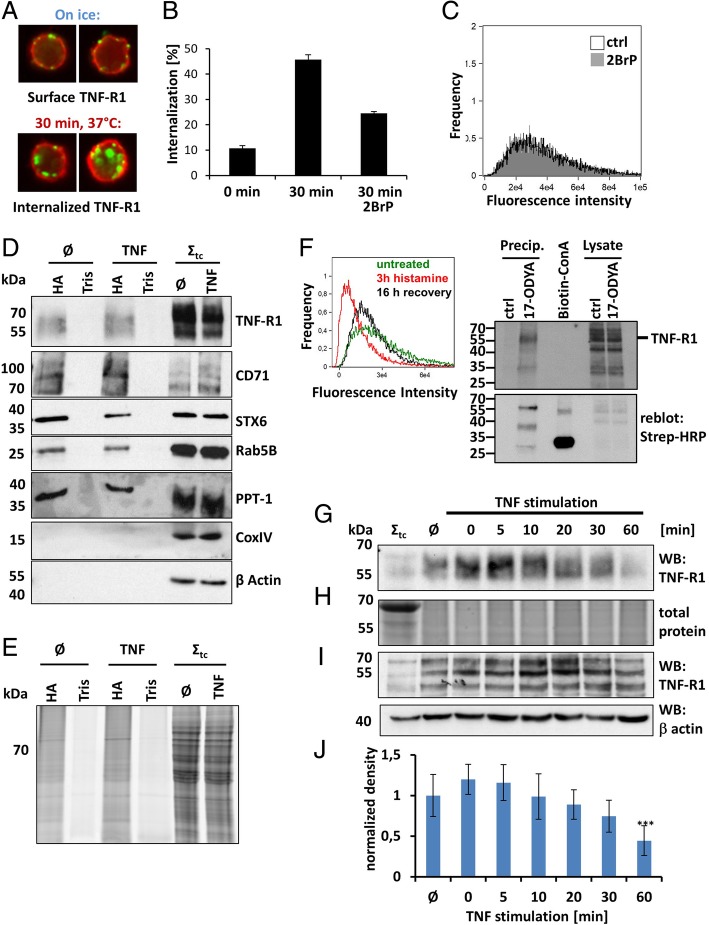
Fig. 1.
Palmitoylation is involved in TNF signaling. a TNF-R1 internalization in response to activation by TNF, quantified by imaging flow cytometry. Representative images of cells kept on ice (upper panel) versus 30 min internalization at 37 °C (lower panel) are shown (TNF/TNF-R1: green, plasma membrane: red). b Treatment of cells with the palmitoylation inhibitor 2-bromopalmitate (2BrP; 50 μM) decreases TNF-R1 internalization. Quantification was performed by imaging flow cytometry. Data of three independent experiments +/− SD are shown. c The TNF-R1 surface expression at steady state is not reduced in 2BrP treated cells. Quantification was performed by imaging flow cytometry. d WB of acylRAC enriched proteins were probed for TNF-R1. Compared to the the total amount in the input, TNF-R1 appears partially palmitoylated as revealed in the captured acylRAC fraction. Known palmitoylated proteins served as positive control: CD71, STX6, Rab5 and PPT1 are present in the input (Σtc) and the (hydroxyl amine) (HA) fractions while Tris lanes show no signals. No difference for untreated (Ø) or 10 min TNF treated cells is apparent. CoxIV and β Actin serve as negative controls. e Total protein staining (lightning red) prior to WB. The hydroxylamine (HA) samples contain enriched protein, while the Tris lanes contain negligible protein. Samples were from untreated (Ø) or 10 min TNF treated cells. Σtc represents the input (cell lysate) for acylRAC. f Left panel: TNF-R1 was shed from the cell surface by histamine treatment (red). After 16 h recovery (black curve) the expression resembled the untreated status (green curve). TNF-R1 was labeled using biotinTNF:Streptavidin alexafluor488. Fluorescence intensity mas measured by imaging flow cytometry. Right panel: During recovery phase, 17-ODYA was added to the cells and incorporated into protein palmitoylated within this time frame. After biotinylation of 17-ODYA by click-chemistry and precipitation using streptavidin microbeads, the material was analyzed by WB and compared to lysate as input control. Upper panel: Probing for TNF-R1 showed TNF-R1 in the 17-ODYA treated and the lysate fraction (input). Lower panel: Biotinylated Concanavalin A was used as positive control for biotinylated proteins. g TNF-R1 WB from acylRAC samples isolated from 0 to 60 min shows a constant decrease in palmitoylated TNF-R1 up to 60 min. h Total protein staining for equal loading prior to WB. i WB of total cell lysate corresponding to the fractions of Fig. 1g and h. The total amount of TNF-R1 was constant over time with a slight decrease at 60 min. β Actin serves as loading control. j Quantitative WB analysis showing TNF-R1 depalmitoylation kinetics (n = 8). All values were normalized to the total TNF-R1 abundance in cell lysates. ***: significant TNF-R1 depalmitoylation (p ≤ 0.001)

