Fig. 5.
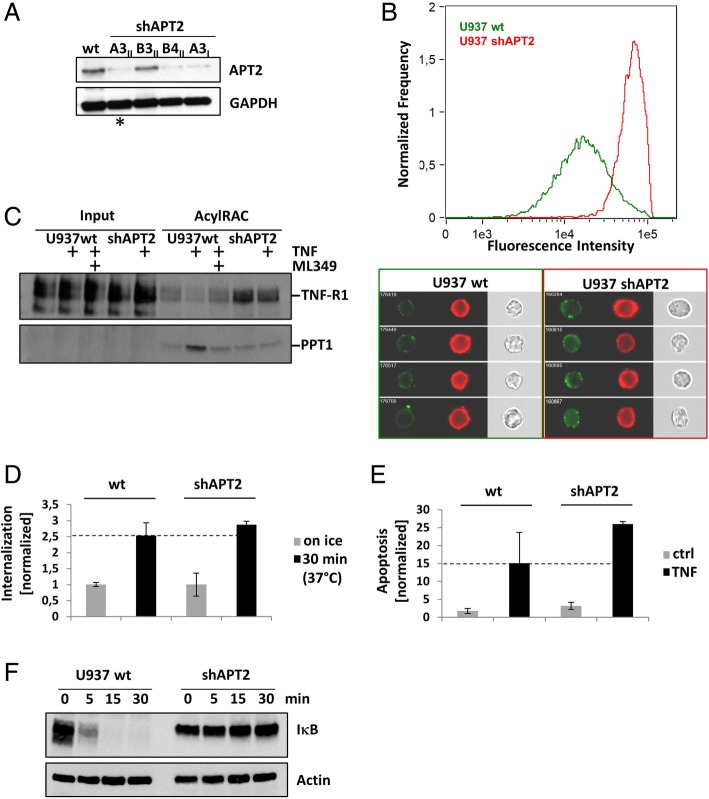
The biological function of APT2 knock-down in TNF signaling. a APT2 expression was knocked-down by shRNA and validated by WB. shAPT2 pool A3II (marked by an asterisk) was used for further experiments. GAPDH was used as loading control. b The histogram shows that TNF-R1 surface expression is higher (red curve) in shAPT2 cells compared to wt (green curve) cells. Sample images from wt (green box) and shAPT2 (red box) cells are shown below. TNF-R1 is labeled using biotinylated-TNF:Streptavidin-alexafluor488 (green), the plasma membrane is labeled with cell mask (red). c TNF-R1 palmitoylation was analyzed by acylRAC. U937 wt cells +/− ML349 were compared to shAPT cells. WB was probed for TNF-R1, PPT1 served as loading control. One representative experiment is shown. d TNF-R1 internalization was not affected by shAPT2 knock-down. Mean values of three experiments are shown. e TNF induced apoptosis is enhanced in shAPT2 cells. Mean values of three experiments are shown. f IκB degradation is inhibited in shAPT2 compared to U937 wt cells. One representative experiment is shown

