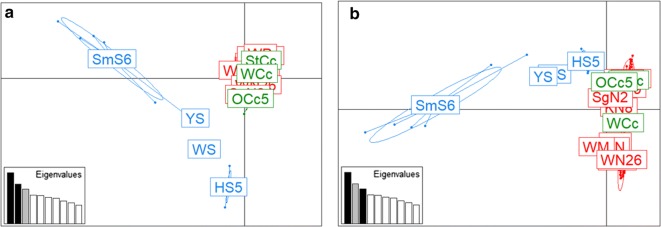
Fig. 2.
Results of the principle components analysis (PCA) of mite populations associated with 17 host populations. PCA showing the genetic structure of 93 mites from 17 host populations with component 1 (explaining 9.96% of the variance) versus component 2 (7.68%) (a) and component 3 (6.76%) (b). The eigenvalues of the two axes are displayed in each graph. Caniformia-, serow- and boar-derived mites are represented as red, green and blue, respectively. Each Host-associated mite population is indicated in the centre of component mites. Abbreviations for populations are provided in Table 1

