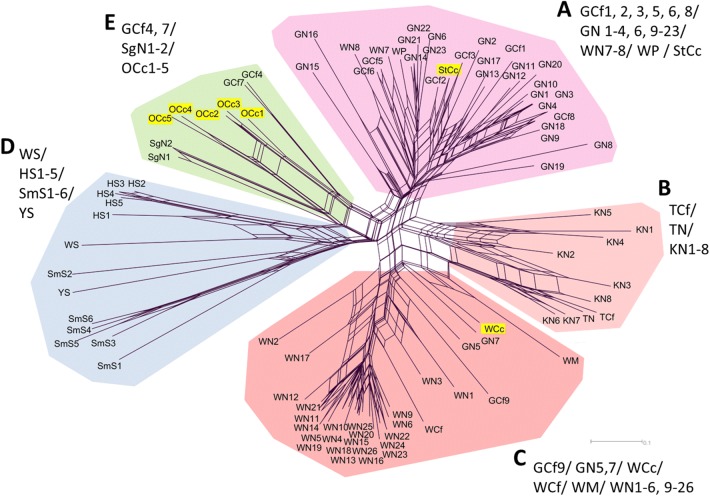
Fig. 3.
NeighborNet network constructed by DSA between each pair of 93 mites. Main clusters (A, B, C, D and E) are separated by different colors. The genetic differentiation between clusters B and C is not clear, and WM, WCc, GN5, GN7 were experientially assorted into Cluster C. Japanese serow-derived mites (StCc, WCc, OCc1-5) are shown with the yellow background. Abbreviations for populations are provided in Table 1

