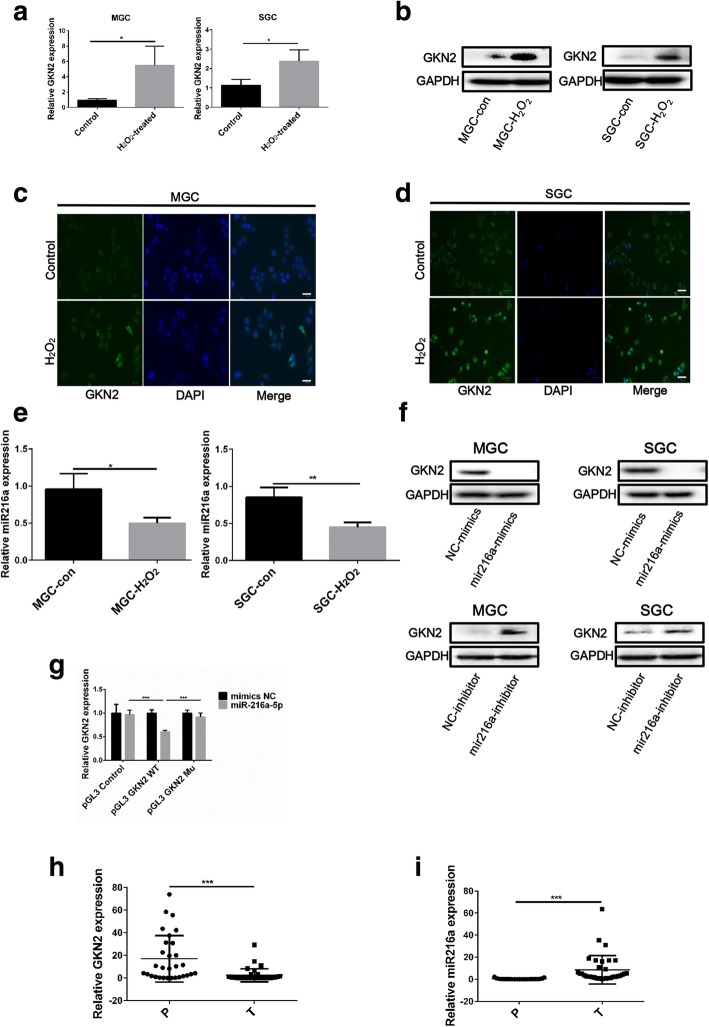
Fig. 1.
Stress-induced GKN2 expression in GC cell lines. aQRT-PCR detection of GKN2 mRNA expression in MGC and SGC cells after H2O2 (300 uM) treatment for 6 h. b GKN2 expression detected by western blotting after H2O2 (300 uM) treatment for 6 h. c-d Immunofluorescence detection of GKN2 expression after H2O2 (300 uM, 6 h) treatment. MGC and SGC cells were pre-treated with or without H2O2 (300 uM) for 6 h. Scale bar: 50 μm. e QRT-PCR detected miR-216a expression after H2O2 (300 uM, 6 h) treatment. f Western blot detection of GKN2 expression in MGC and SGC cells transfected with miR-216a mimics (50 nM) and inhibitor (50 nM) for 48 h. (g) MiR-216a significantly decreased luciferase report gene activities of GKN2 3’-UTR pGL3-promoter. h-i GKN2 and miR-216a expression was detected by qRT-PCR in gastric tumor tissue and peripheral tissue. P: para-carcinoma tissues; T: tumor tissues. Dots are the values of GKN2 and mir-216a expression; the error bar indicates the SD. Asterisks indicate statistically significant differences from each other; *p < 0.05, **p < 0.01, ***p < 0.001

