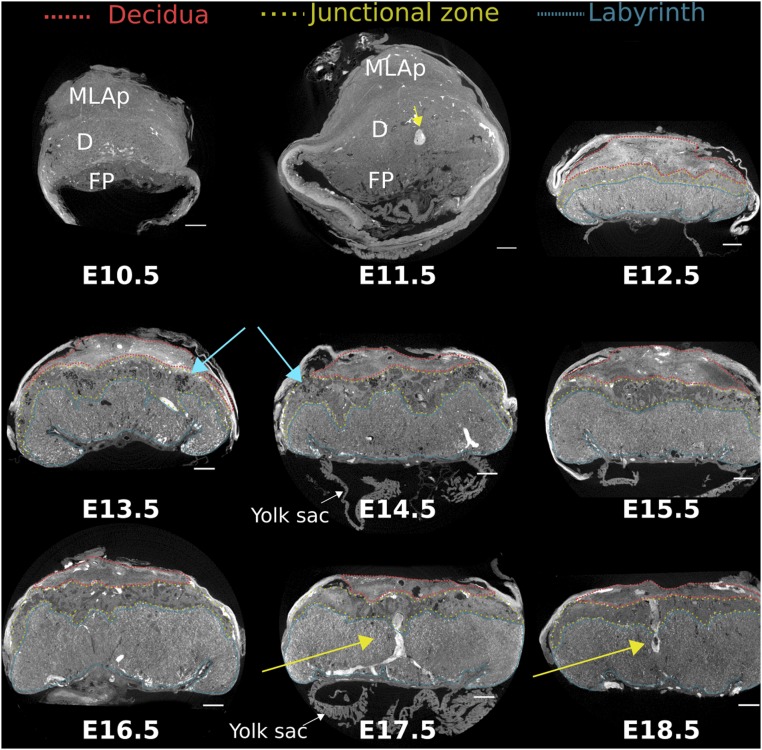
Fig. 3.
Cross-sectional CE-CT images from E10.5–E18.5 placentas, with the different layers indicated. MLAp, mesometrial lymphoid aggregate of pregnancy; D, decidua (red); FP, fetal placenta; junctional zone (yellow); labyrinth (blue); blue arrow, lacunae in junctional zone; yellow arrow, maternal canal. Samples obtained from 129S6 mice. (Scale bar, 500 µm.)

