Fig. 7.
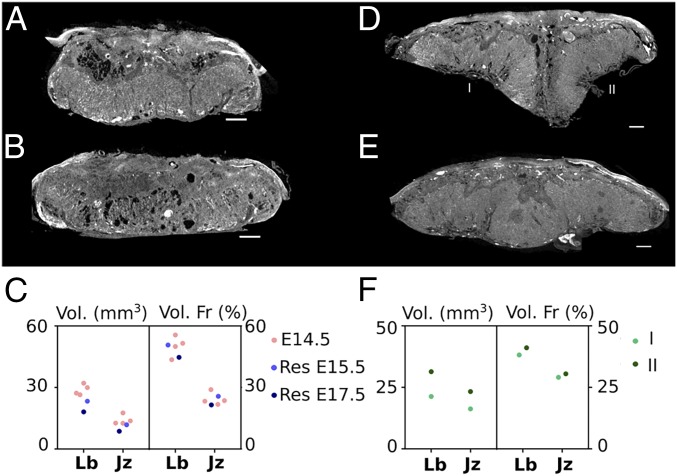
Visualization and quantification of biological variances in placenta. (A) CE-CT cross section of the placenta isolated from a resorbed 129S6 embryo at E15.5. (B) CE-CT cross section of the placenta isolated from a resorbed 129S6 embryo at E17.5. (C) Quantification of the absolute volume and the volume fraction of the placentas (labyrinth [Lb] and junctional zone [Jz]) from resorbed embryos, compared with the characteristics of an E14.5 placenta. (D) CE-CT cross section of a fused placenta from a C57BL/6J mouse at E18.5. (E) CE-CT cross section of a twin placenta from a C57BL/6J mouse at E18.5. (F) Quantification of the absolute volume and the volume fraction of the 2 parts of the fused placentas. (Scale bar, 500 µm.)

