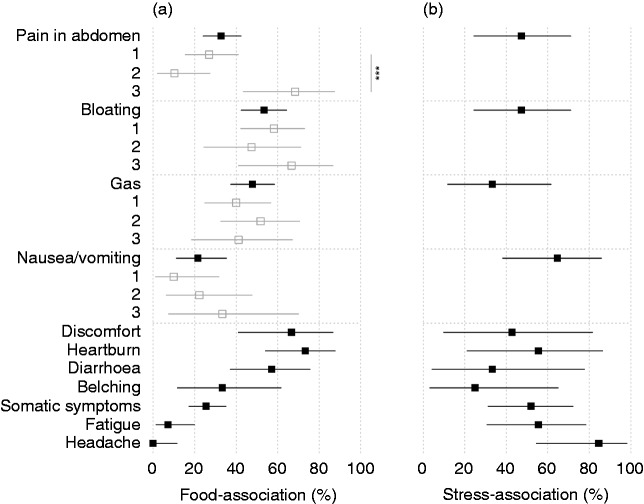
Figure 4.
Percentage of individuals with a demonstrable association between food intake and symptoms (a) and between psychological distress and symptoms (b). Also shown for the latent classes of symptom patterns during the day (grey) wherever statistical power allows it. Whiskers are 95% confidence intervals. ***p < 0.001.

