Figure 5.
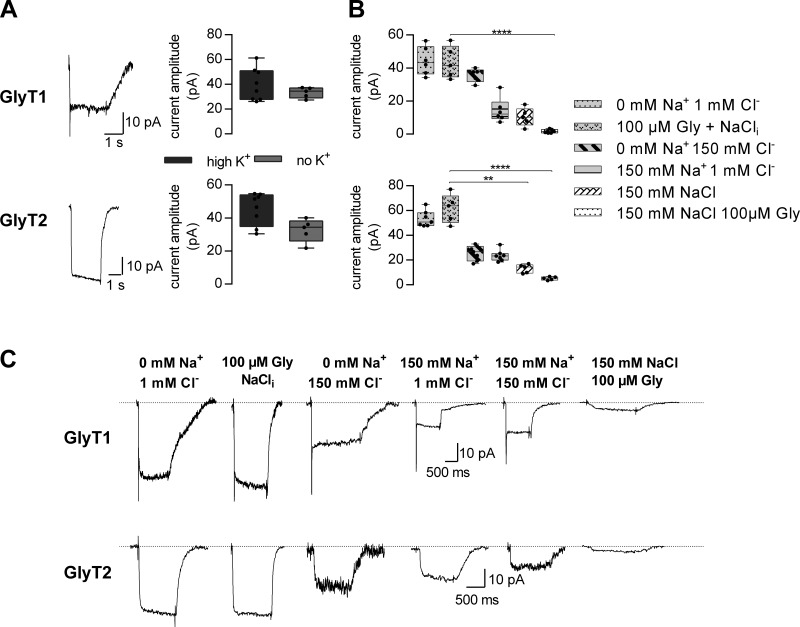
The effect of intracellular ions on currents carried by GlyT1 and GlyT2. (A) Sample traces of currents through GlyT1 (upper trace) and GlyT2 (lower trace), induced by the application of 1 mM glycine. The displayed currents were recorded at −60 mV in the absence of intracellular K+. The box plots show the comparison of current amplitudes in presence of 150 mM intracellular K+ and in absence thereof (n = 6–8). Omission of intracellular K+ did not change the current amplitude of GlyT1 (upper right panel) and GlyT2 (lower right panel) significantly (P = 0.49, Mann–Whitney U test). (B) Comparison of current amplitudes for the indicated intracellular conditions at −60 mV (n = 5–7 for each GlyT1 and GlyT2). In the case of GlyT1, there was significant current suppression in the presence of 150 mM intracellular Cl−, Na+, and 100 µM glycine. In the case of GlyT2, there was significant current inhibition in the presence of 150 mM intracellular Cl− and Na+ (1) without and (2) with 100 µM glycine (Kruskal–Wallis test, Dunn’s post hoc test). Error bars in A and B represent SD. (C) Sample traces of currents by GlyT1 (upper panel) and GlyT2 (lower panel) in the presence of the indicated intracellular concentrations of Na+, Cl−, and glycine (Gly). NaCli is the standard internal solution described in experimental procedures. ***, P ≤ 0.01; ****, P ≤ 0.001 (Kruskal–Wallis test, Dunn's post hoc test).

