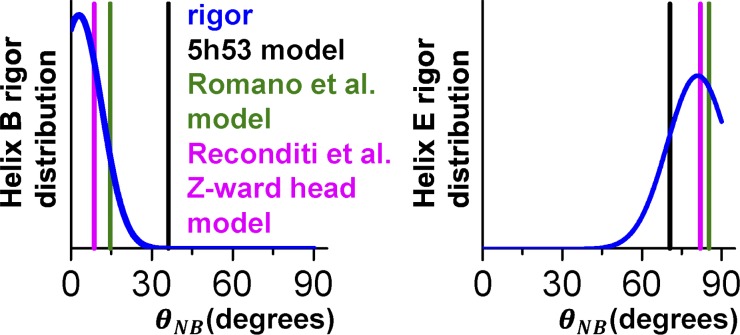
Figure 7.
Comparison of the probe angular distributions measured by EPR and other methods. Spectra of BSL–RLC–fiber in rigor (blue) with a prediction derived from S1 cryo-EM 5H53 model (black), BR fluorescence polarization on skinned fibers (green), and Z-ward head of the double-head model derived from x-ray interference experiment on fibers (magenta).

