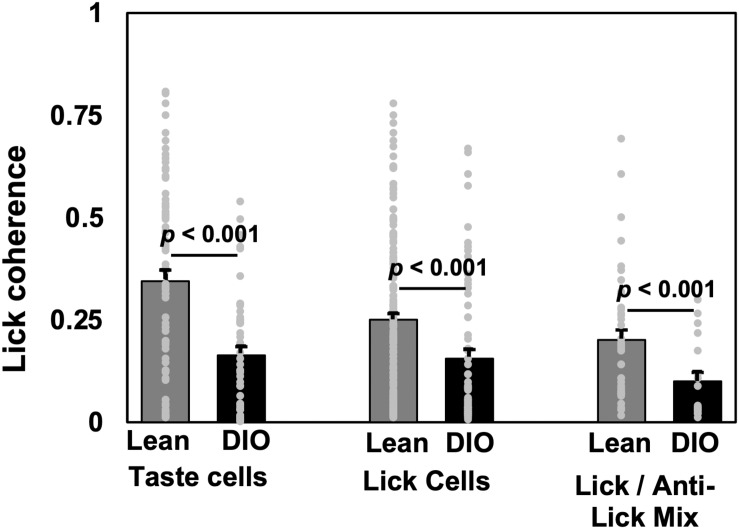
FIGURE 6.
Lick coherence in taste-responsive, lick, and lick/anti-lick mix cells. Mean and individual values from each cell. Peak values of lick coherence within the 4–9 Hz range are shown. Cell numbers ae as follows: for lean rats, n = 74 taste cells, n = 172 lick-related cells, n = 43 anti-lick mix cells; for DIO rats, n = 49 taste cells, n = 66 lick-related cells, and n = 19 anti-lick mix cells. For all cell categories, NTS cells in DIO rats show significantly less lick coherence than NTS cells in lean rats.

